Memory Analysis (Beta)
Advanced memory dump analysis with support for all Windows versions from XP to 11, for both x86 and x64 architectures.
It is not feasible to list all the capabilities of our solution, as it is continuously evolving and this page may not always reflect the most recent additions. Instead, our goal here is to give you an overview of some of its features. It’s worth noting that our memory analysis solution doesn’t rely on external frameworks and is entirely developed in-house. It provides not only an intuitive graphical interface for conducting memory forensics, but also an independent point of comparison to existing solutions.
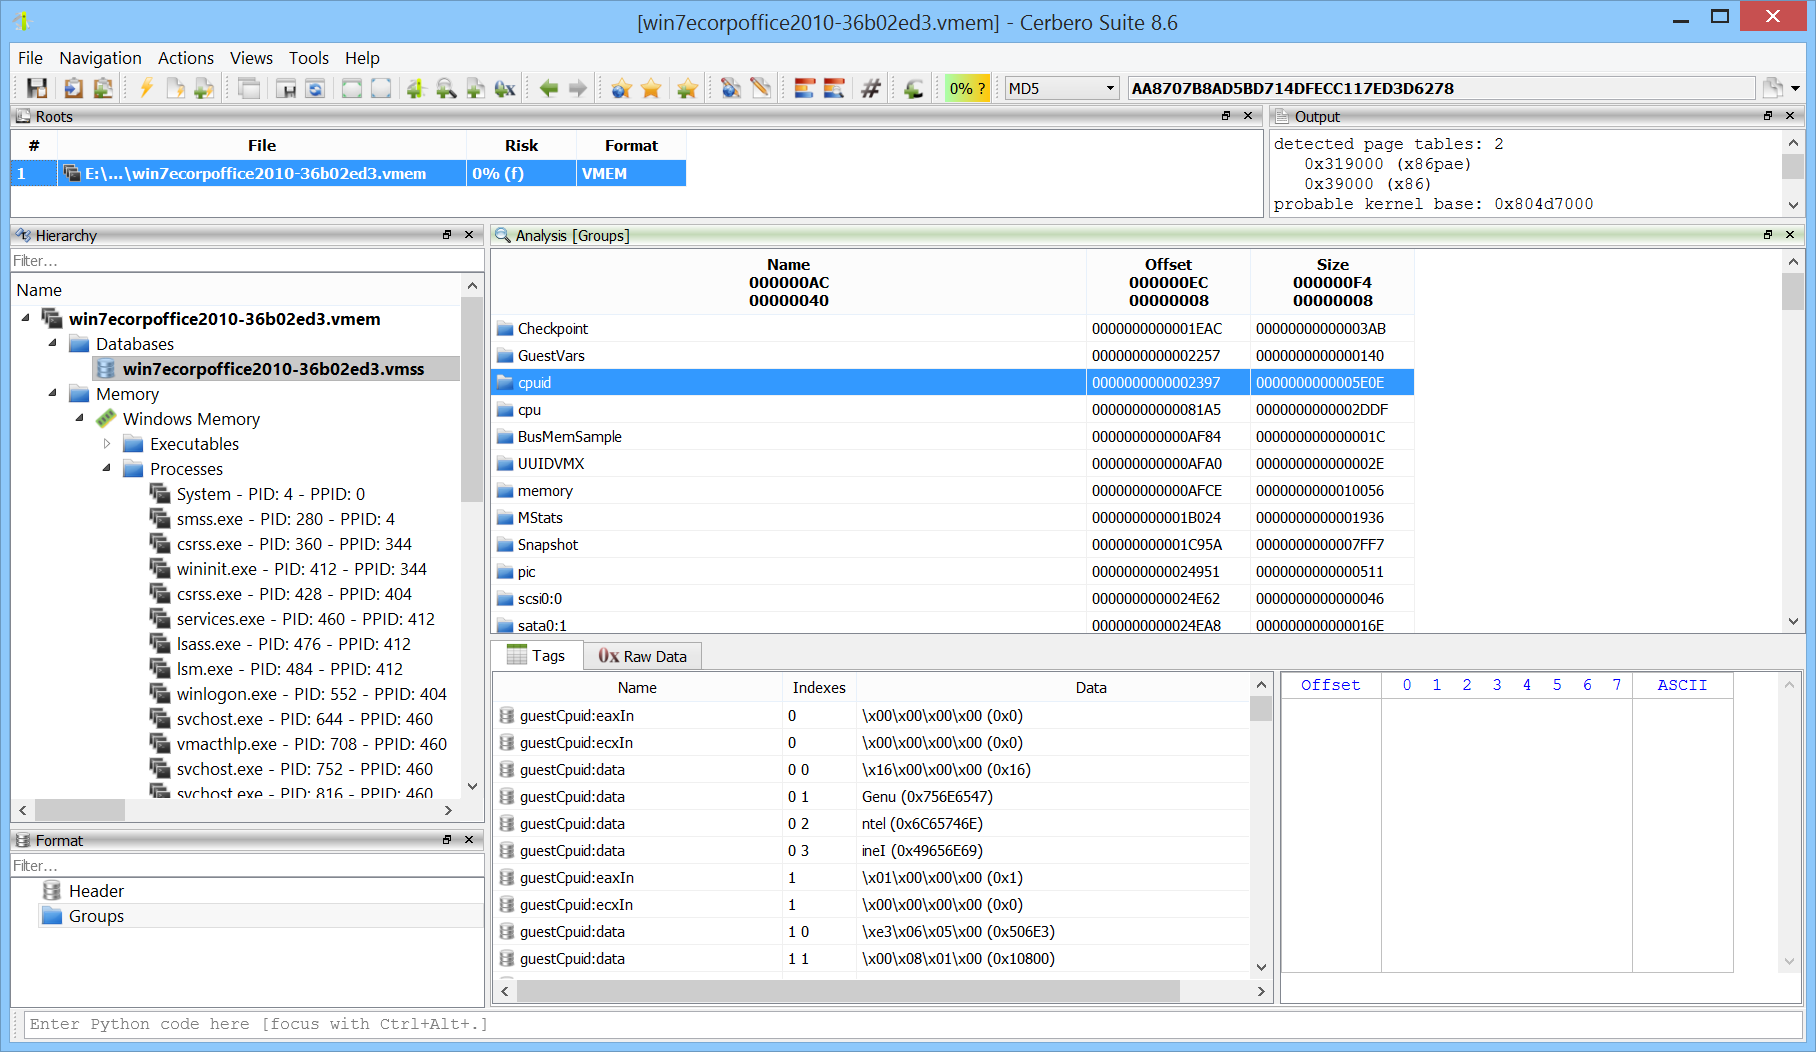
When opening a memory dump, an initialization dialog is displayed that allows you to select the appropriate profile for the dump, as well as configure paging support and scanning options. Various dump formats are supported, including raw images, Windows crash dumps, VMWare VMEM/VMSS files, and VirtualBox core dumps.
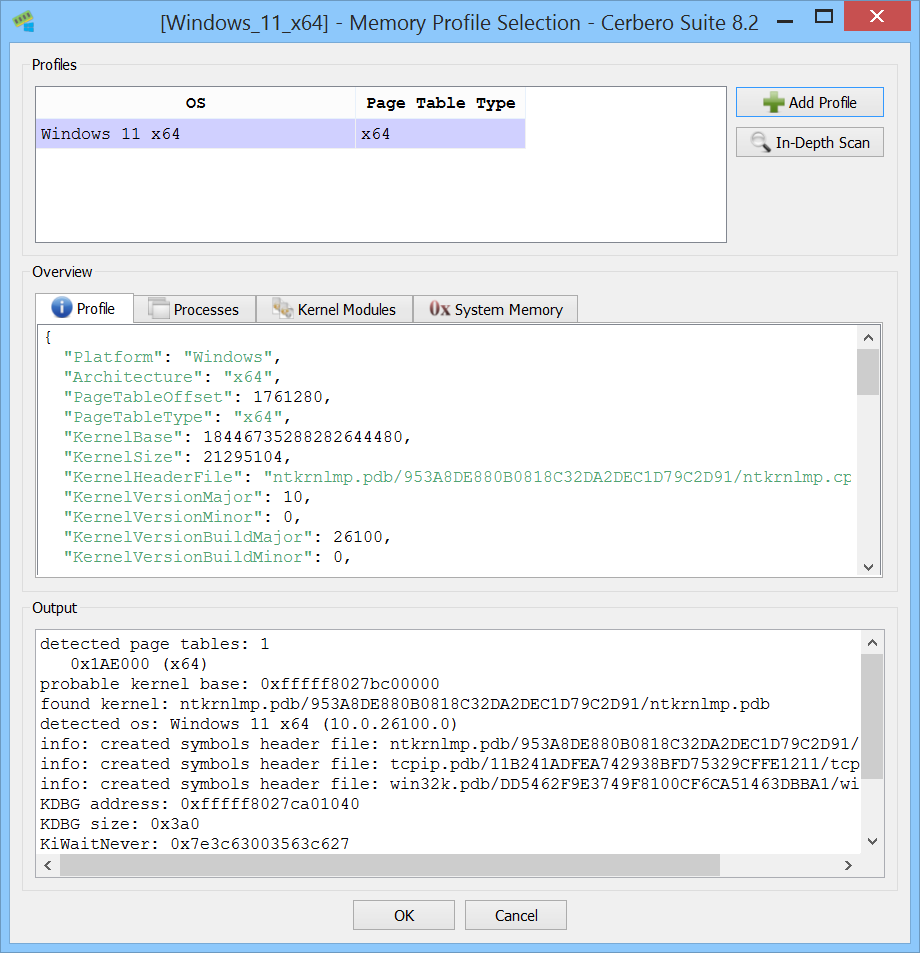
The initialization dialog provides a preview to confirm the correctness of the selected memory profile.
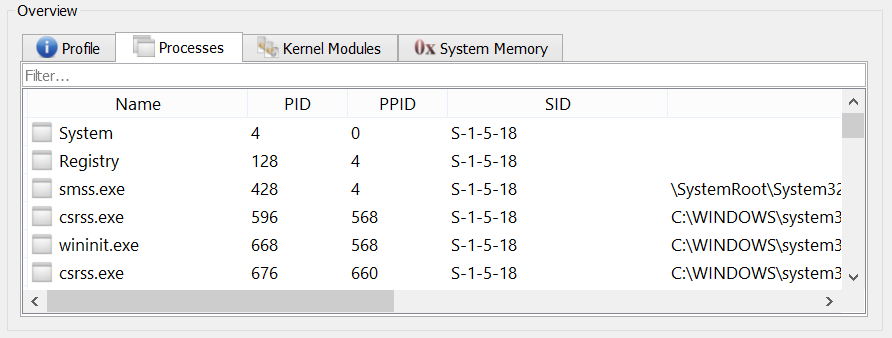
In addition to skipping the scanning of processes in a memory dump or scanning all of them, you can choose to scan only specific processes of interest—making your analysis faster and more focused.
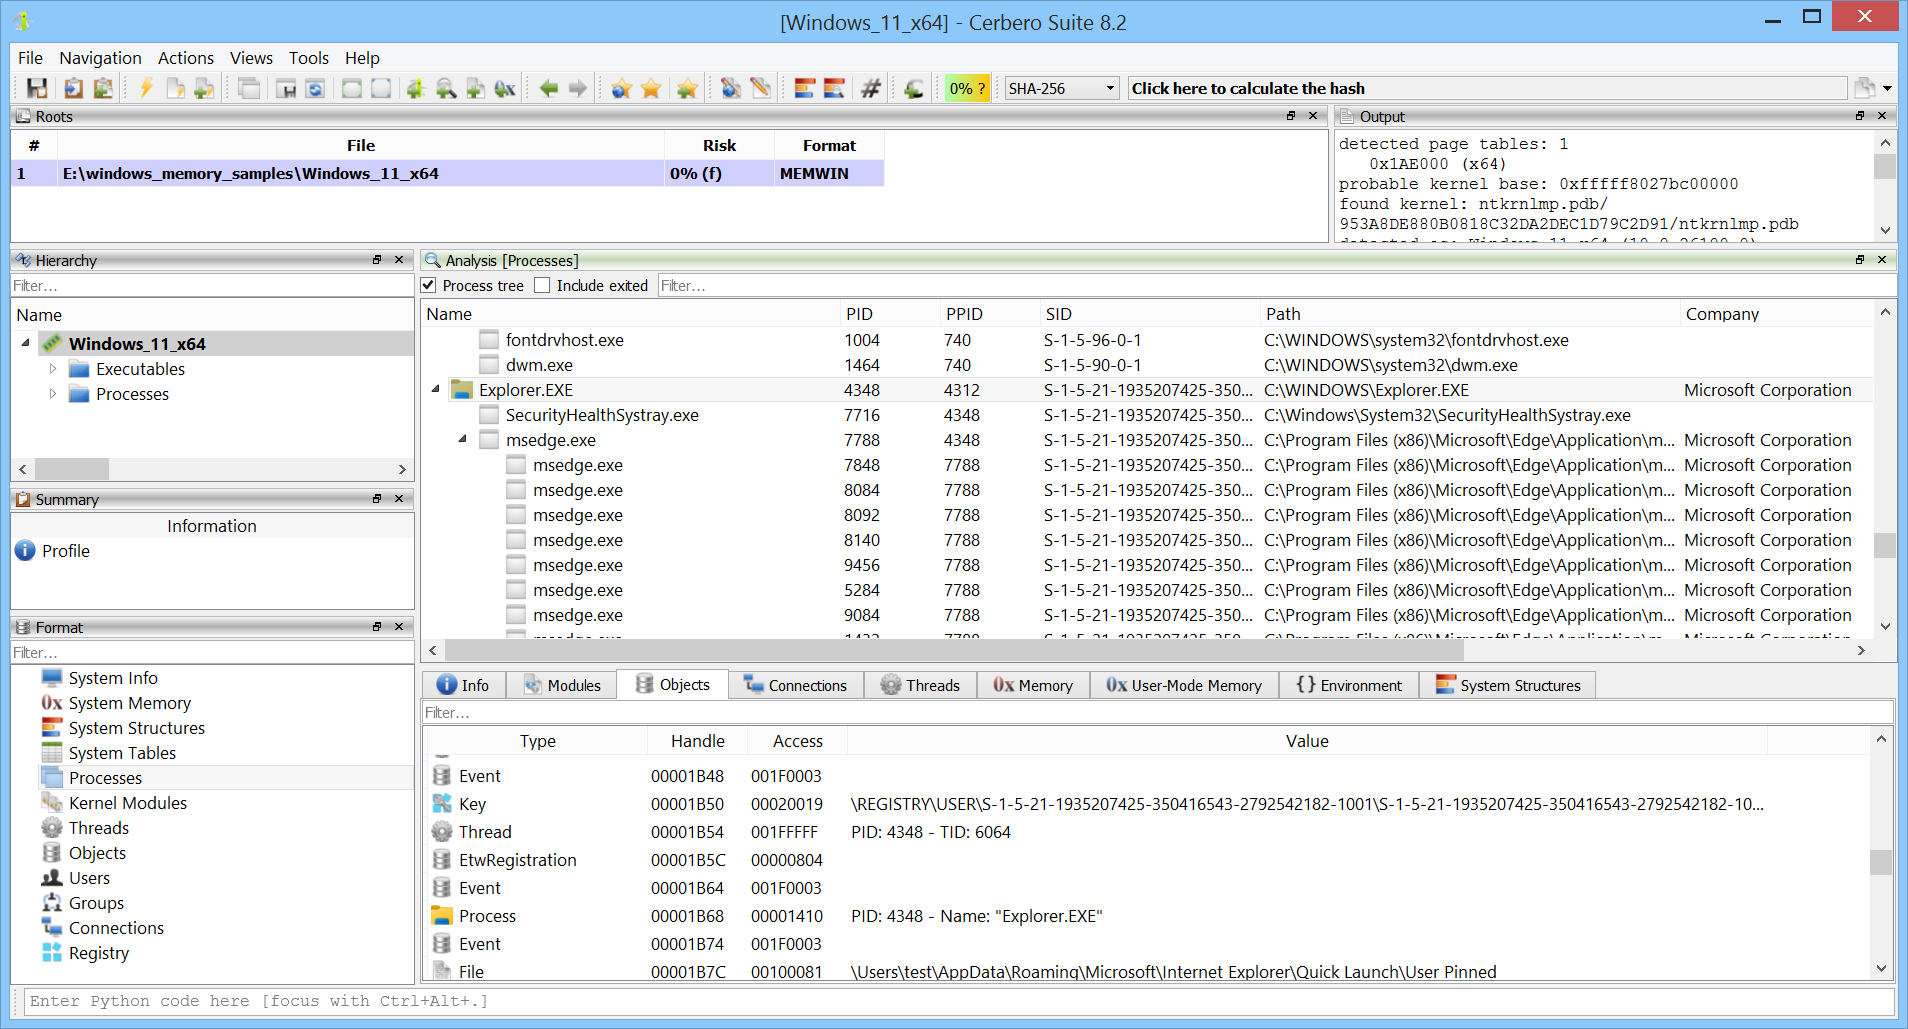
After specifying the profile and options, the memory dump can be inspected in the analysis workspace.
Every list view supports filtering for quick access to relevant items.
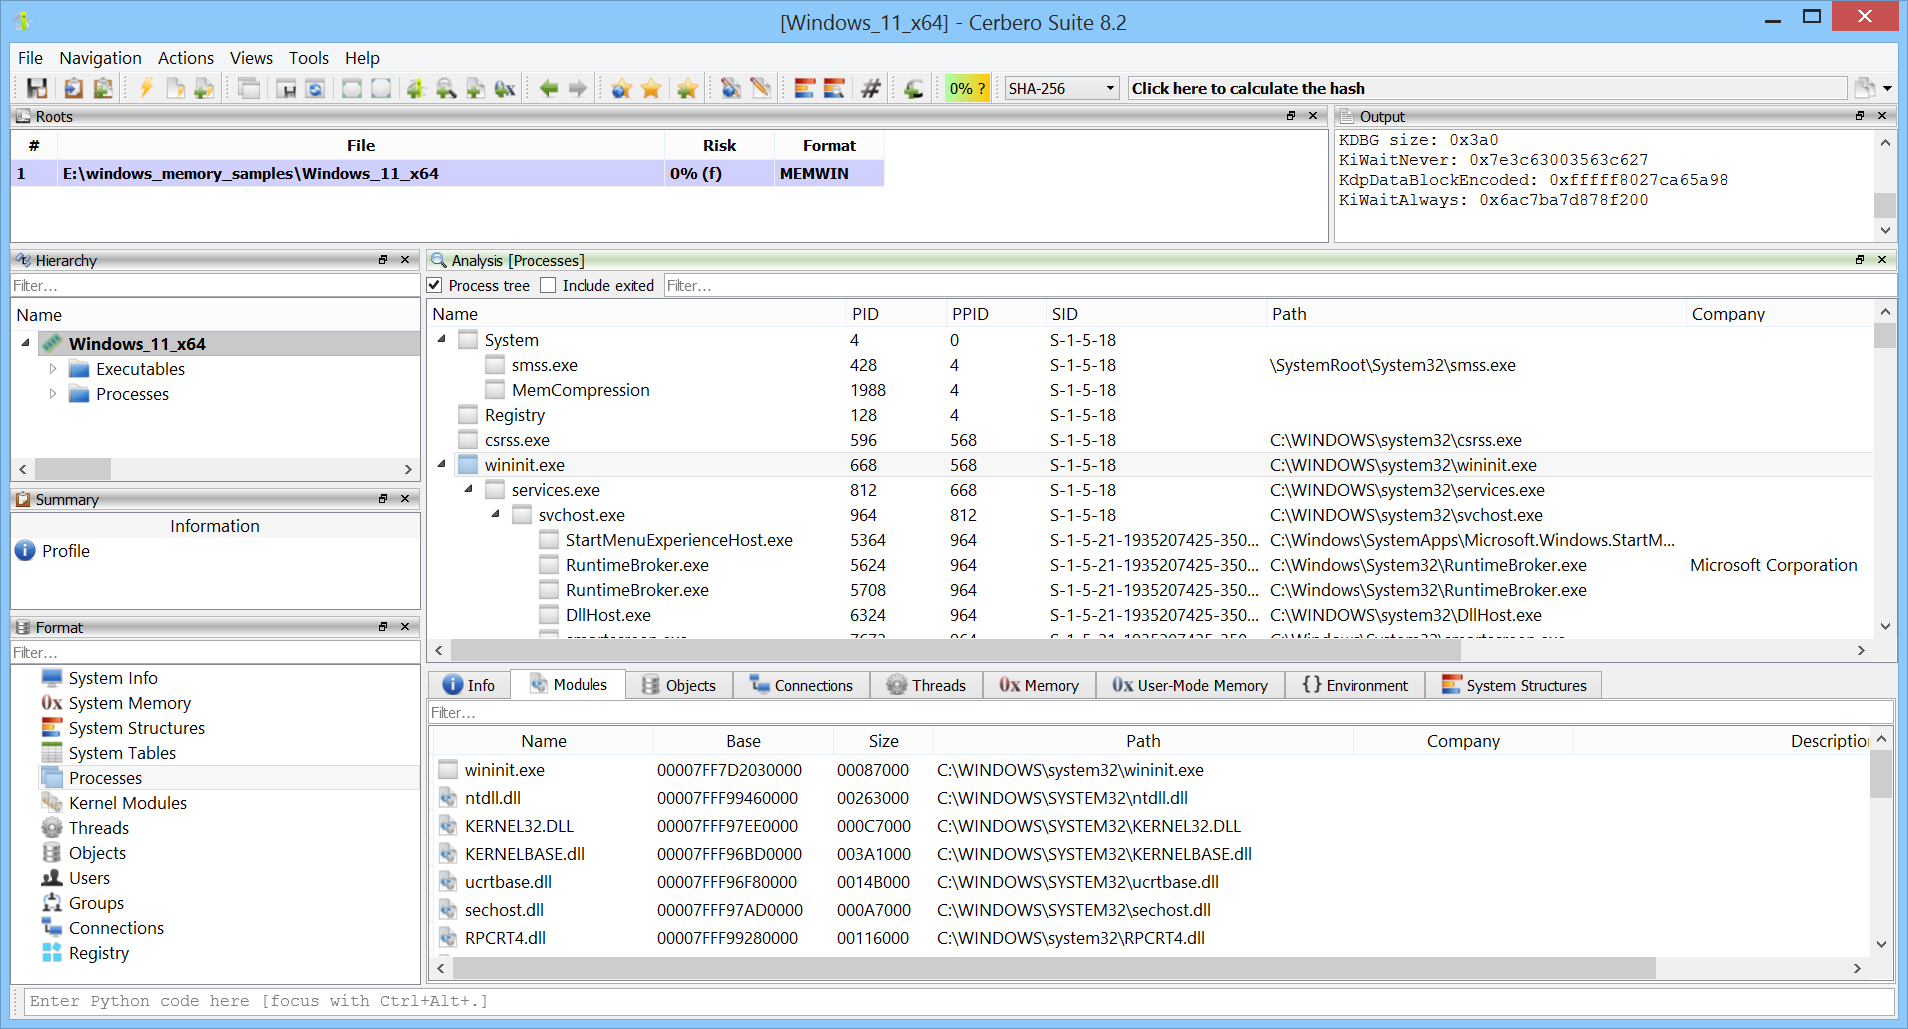
Processes and modules are hyperlinked, allowing you to jump directly to a process or module analysis from any view. When opening a memory dump, you can choose to skip scanning processes and modules for faster inspection—yet still jump directly to a specific module and inspect it.
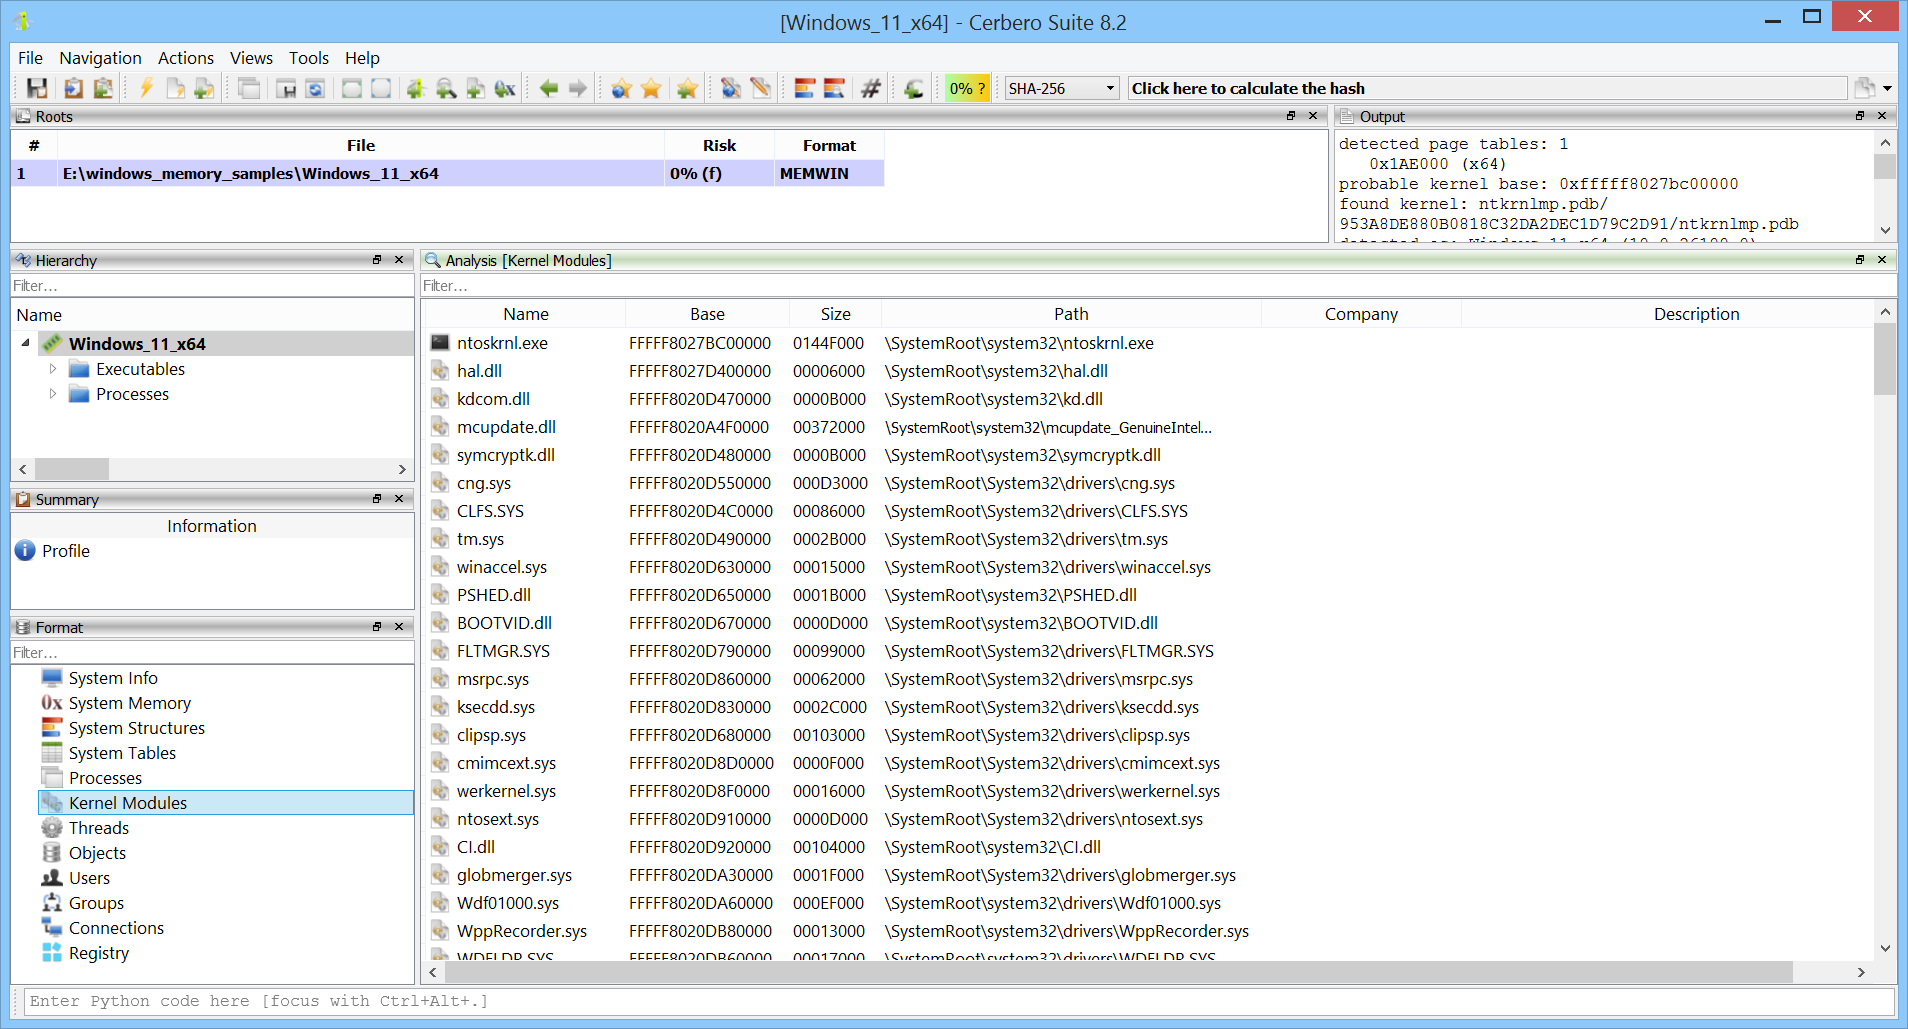
Loaded kernel modules can be examined.
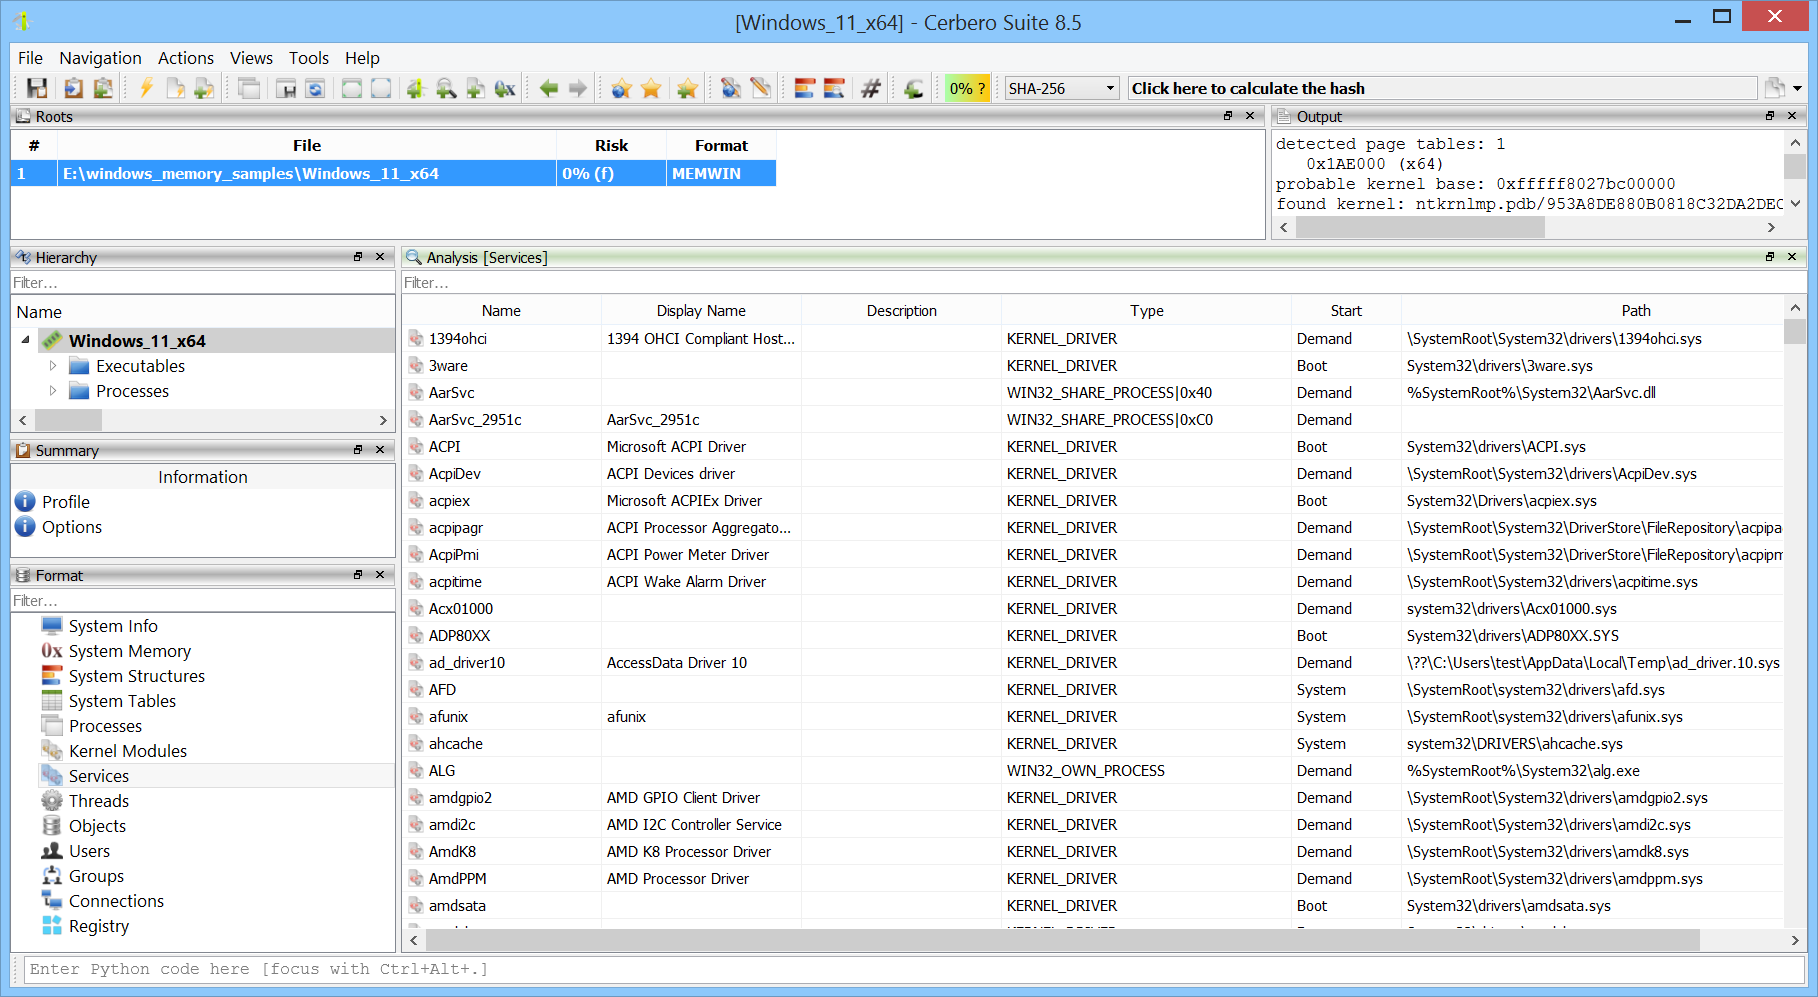
Registered services are enumerated.
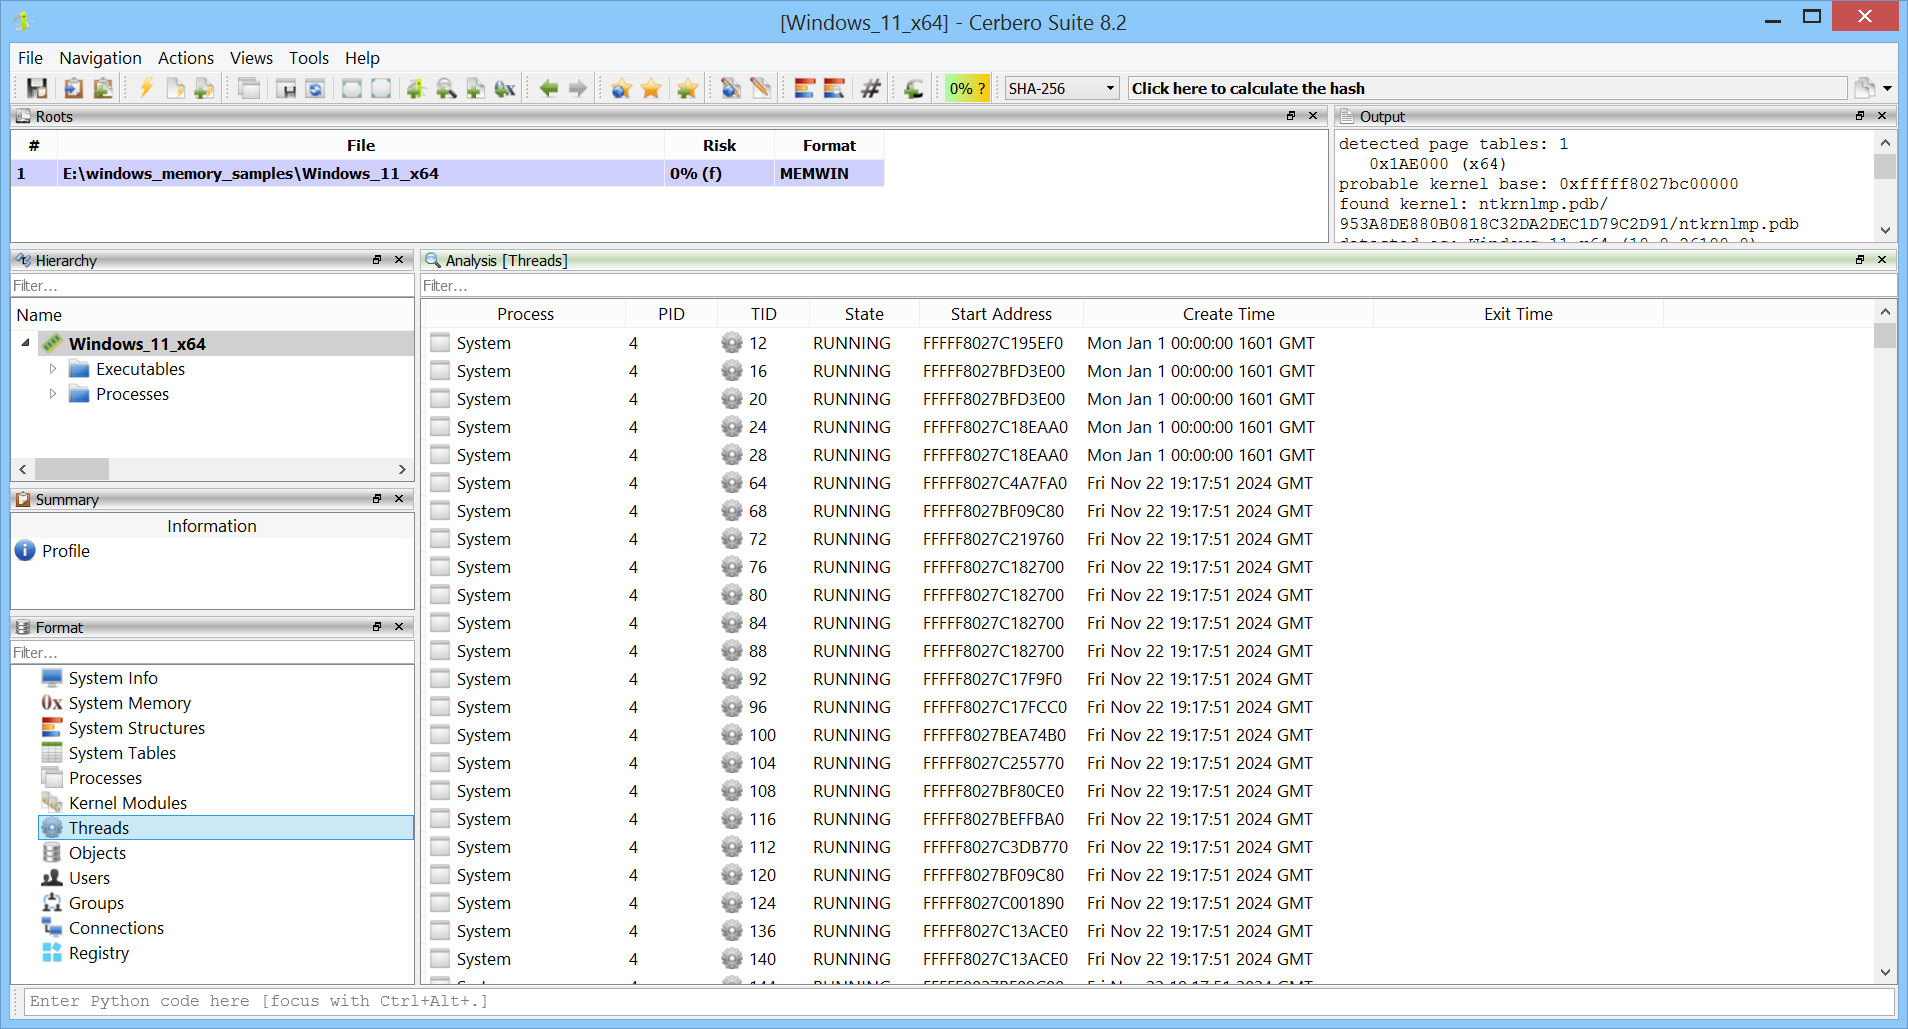
Threads from all processes are also available.
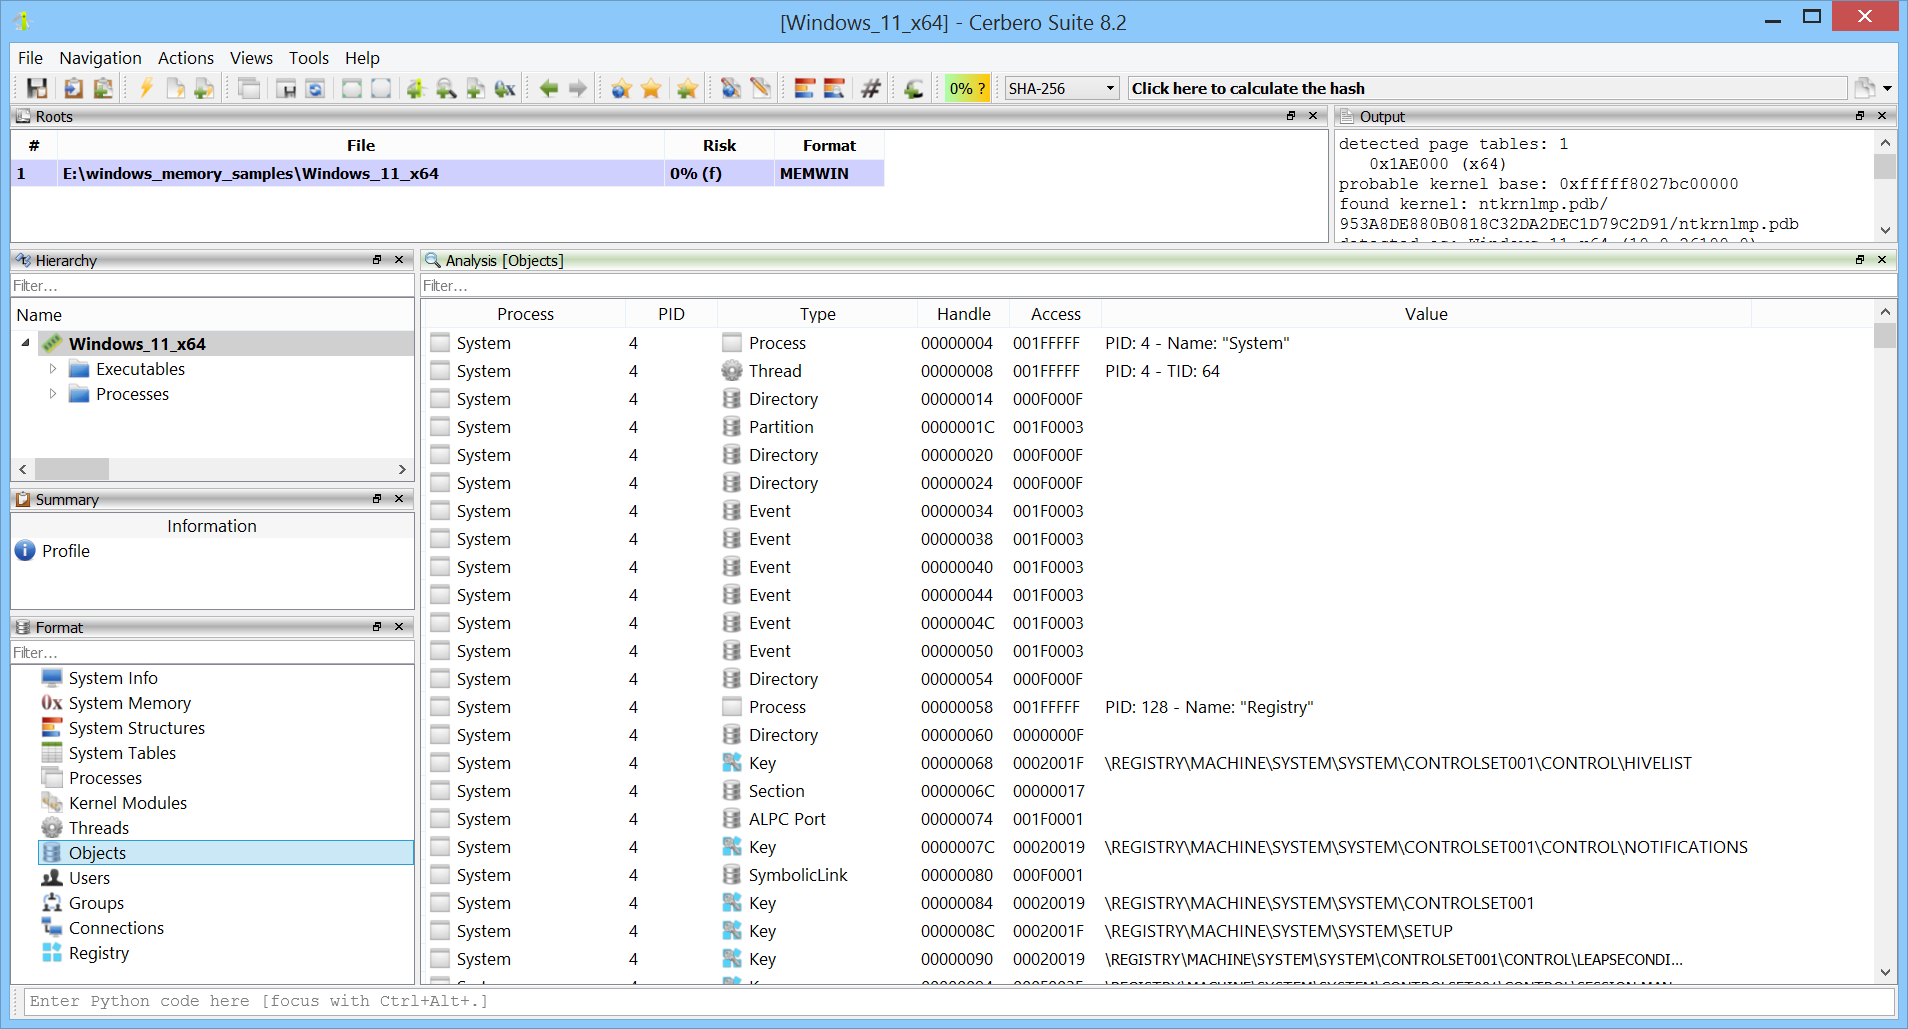
Objects references from all processes can be inspected.
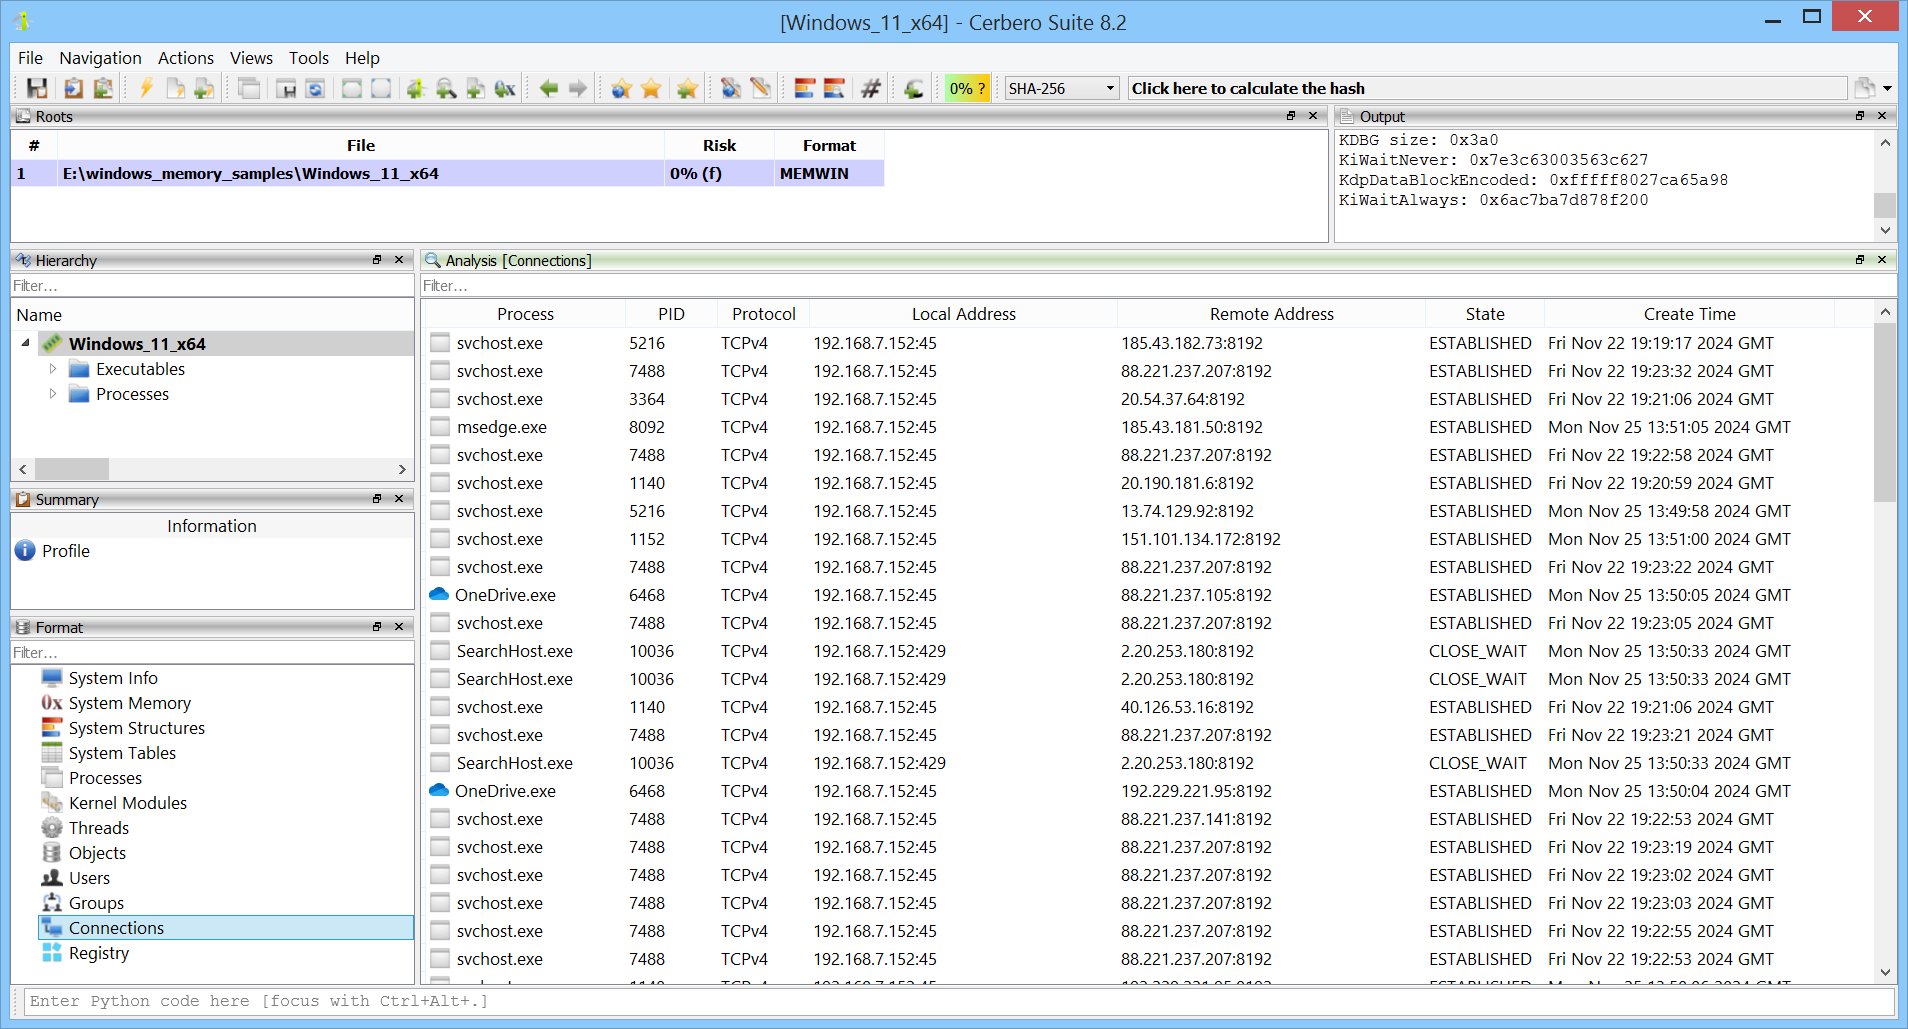
Active network connections can be reviewed.
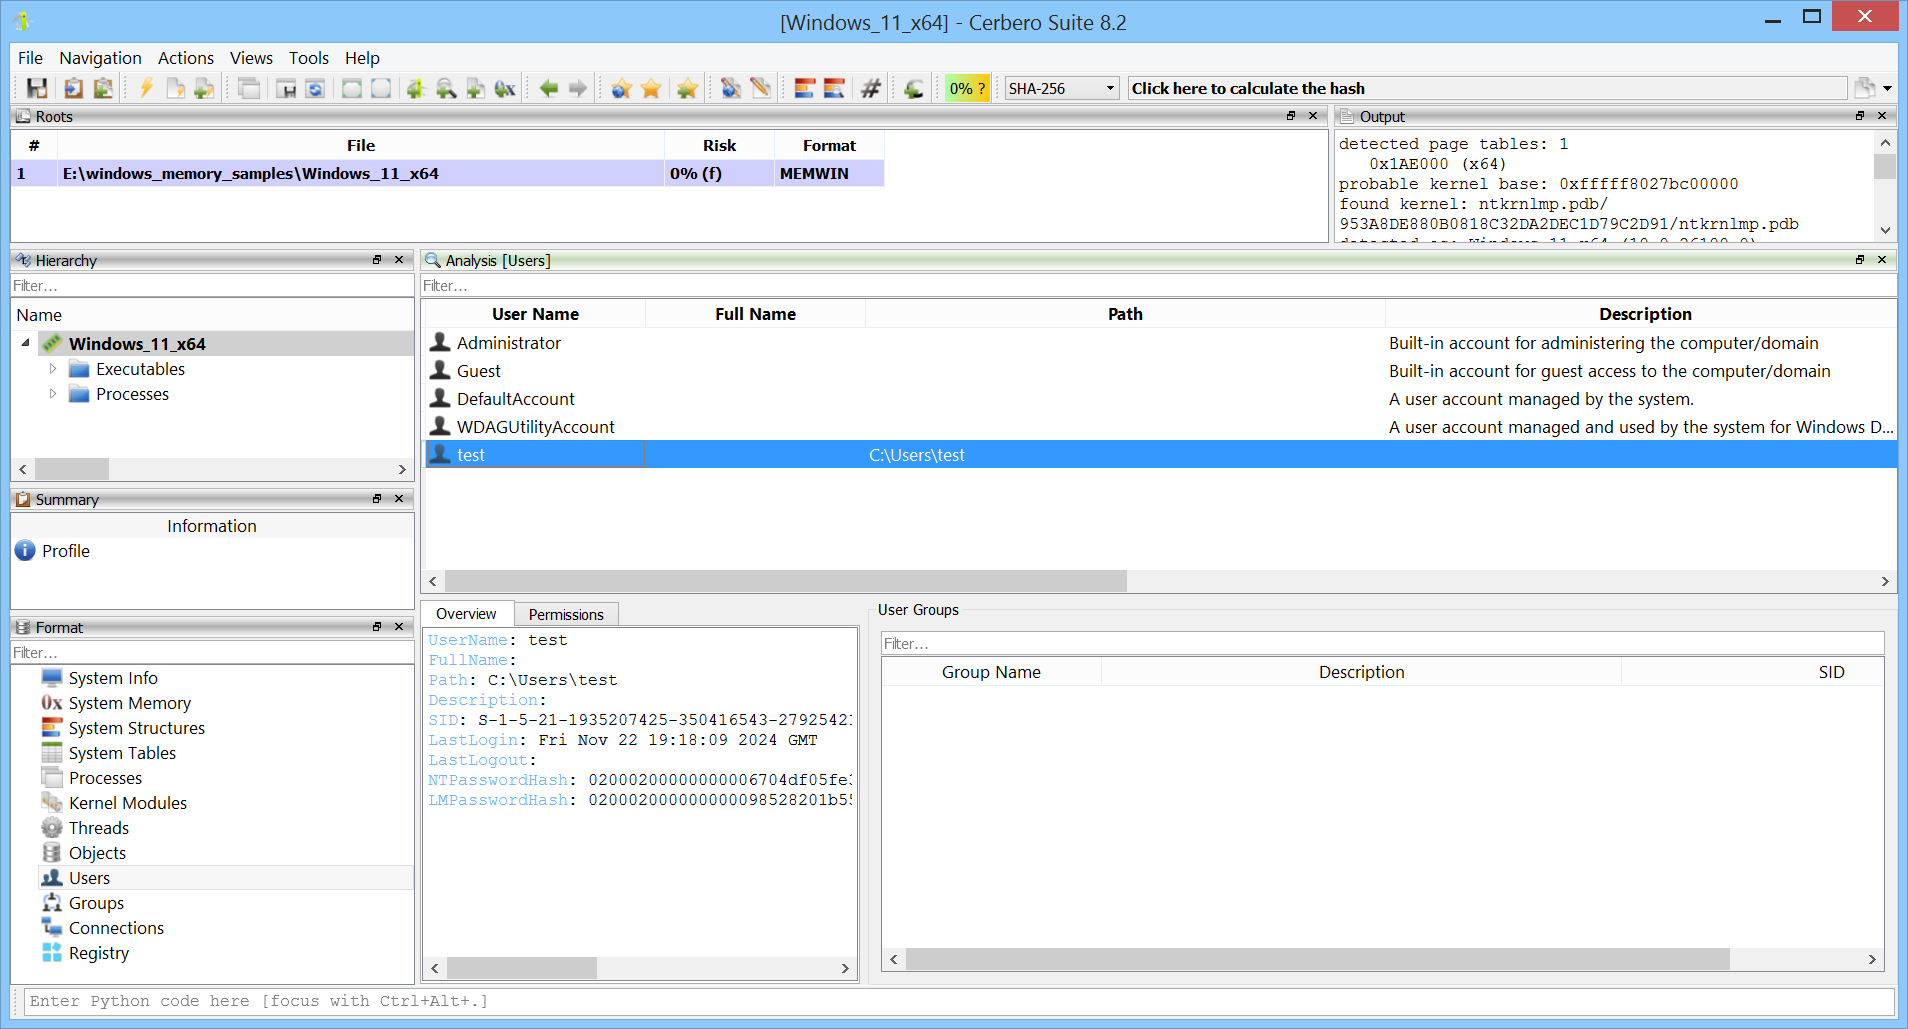
System users and groups, along with their properties, can be examined.
Registry hives loaded in memory are displayed in a familiar interface.
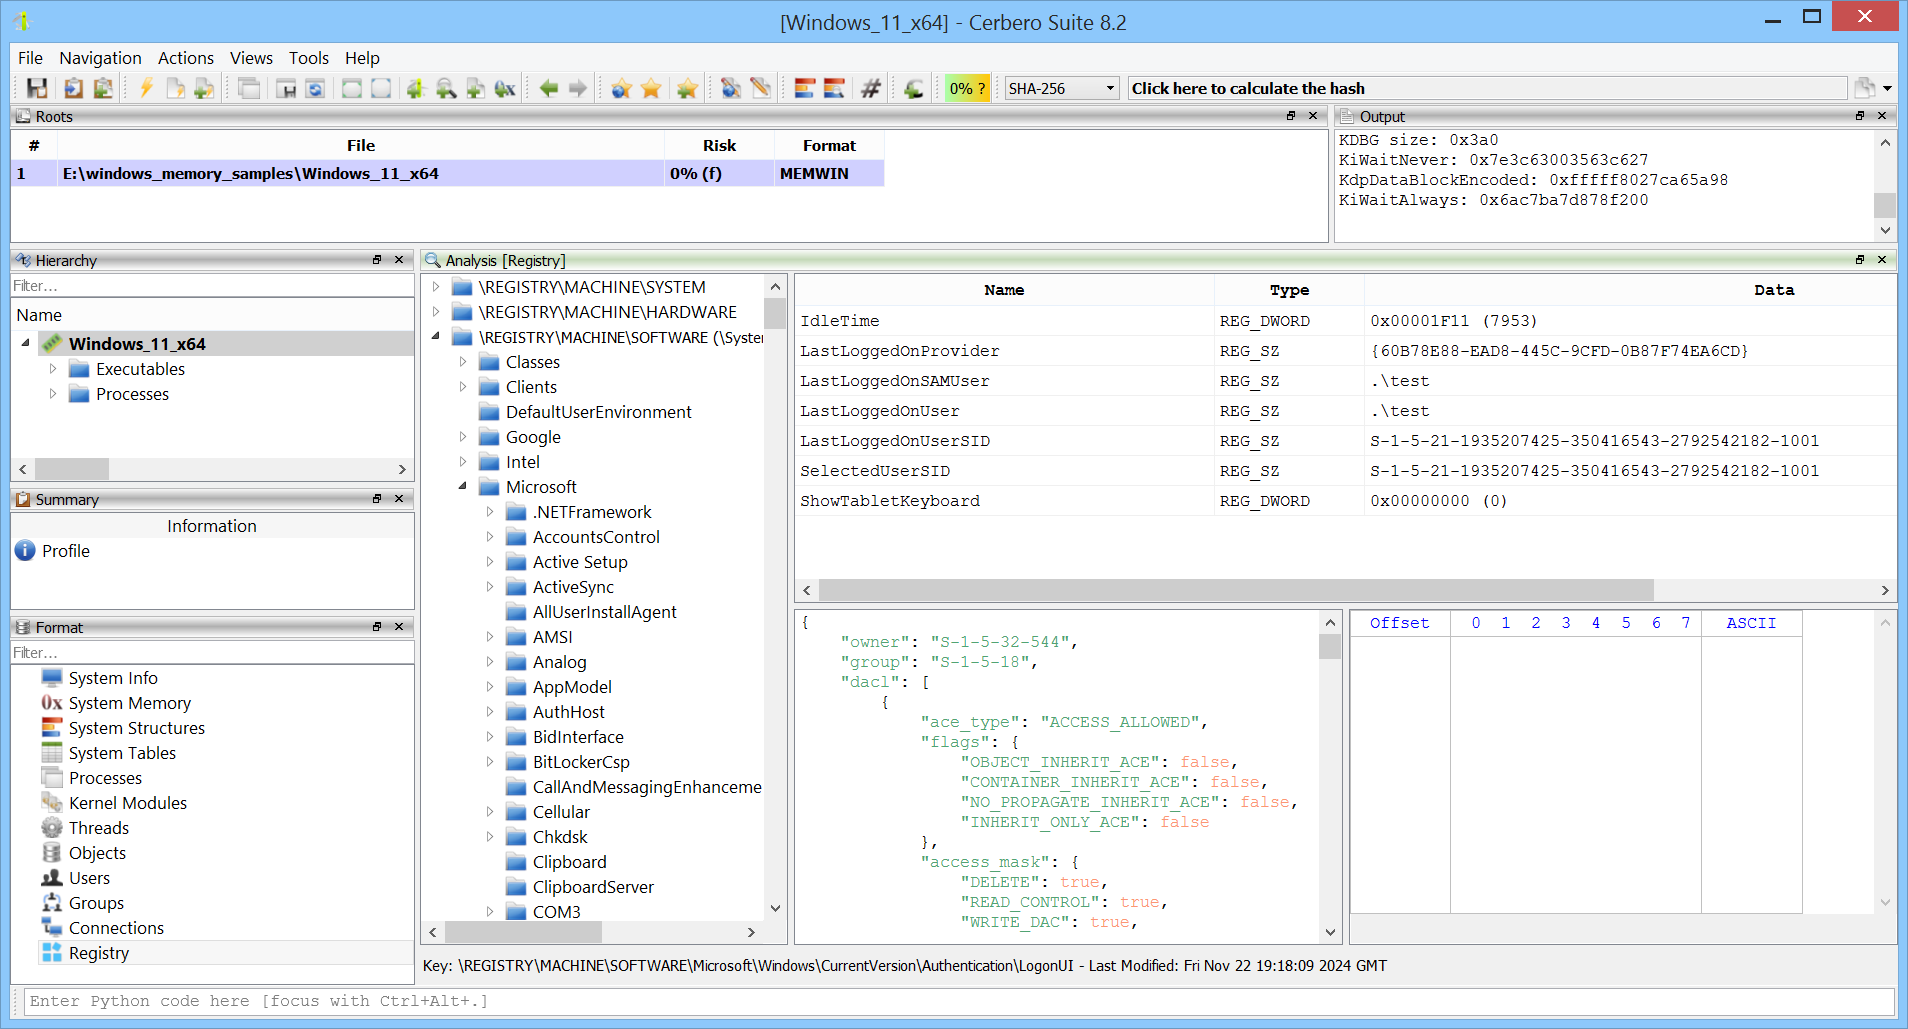
It is also possible to jump directly to specific registry keys.
GUI elements such as desktops and windows can be inspected.
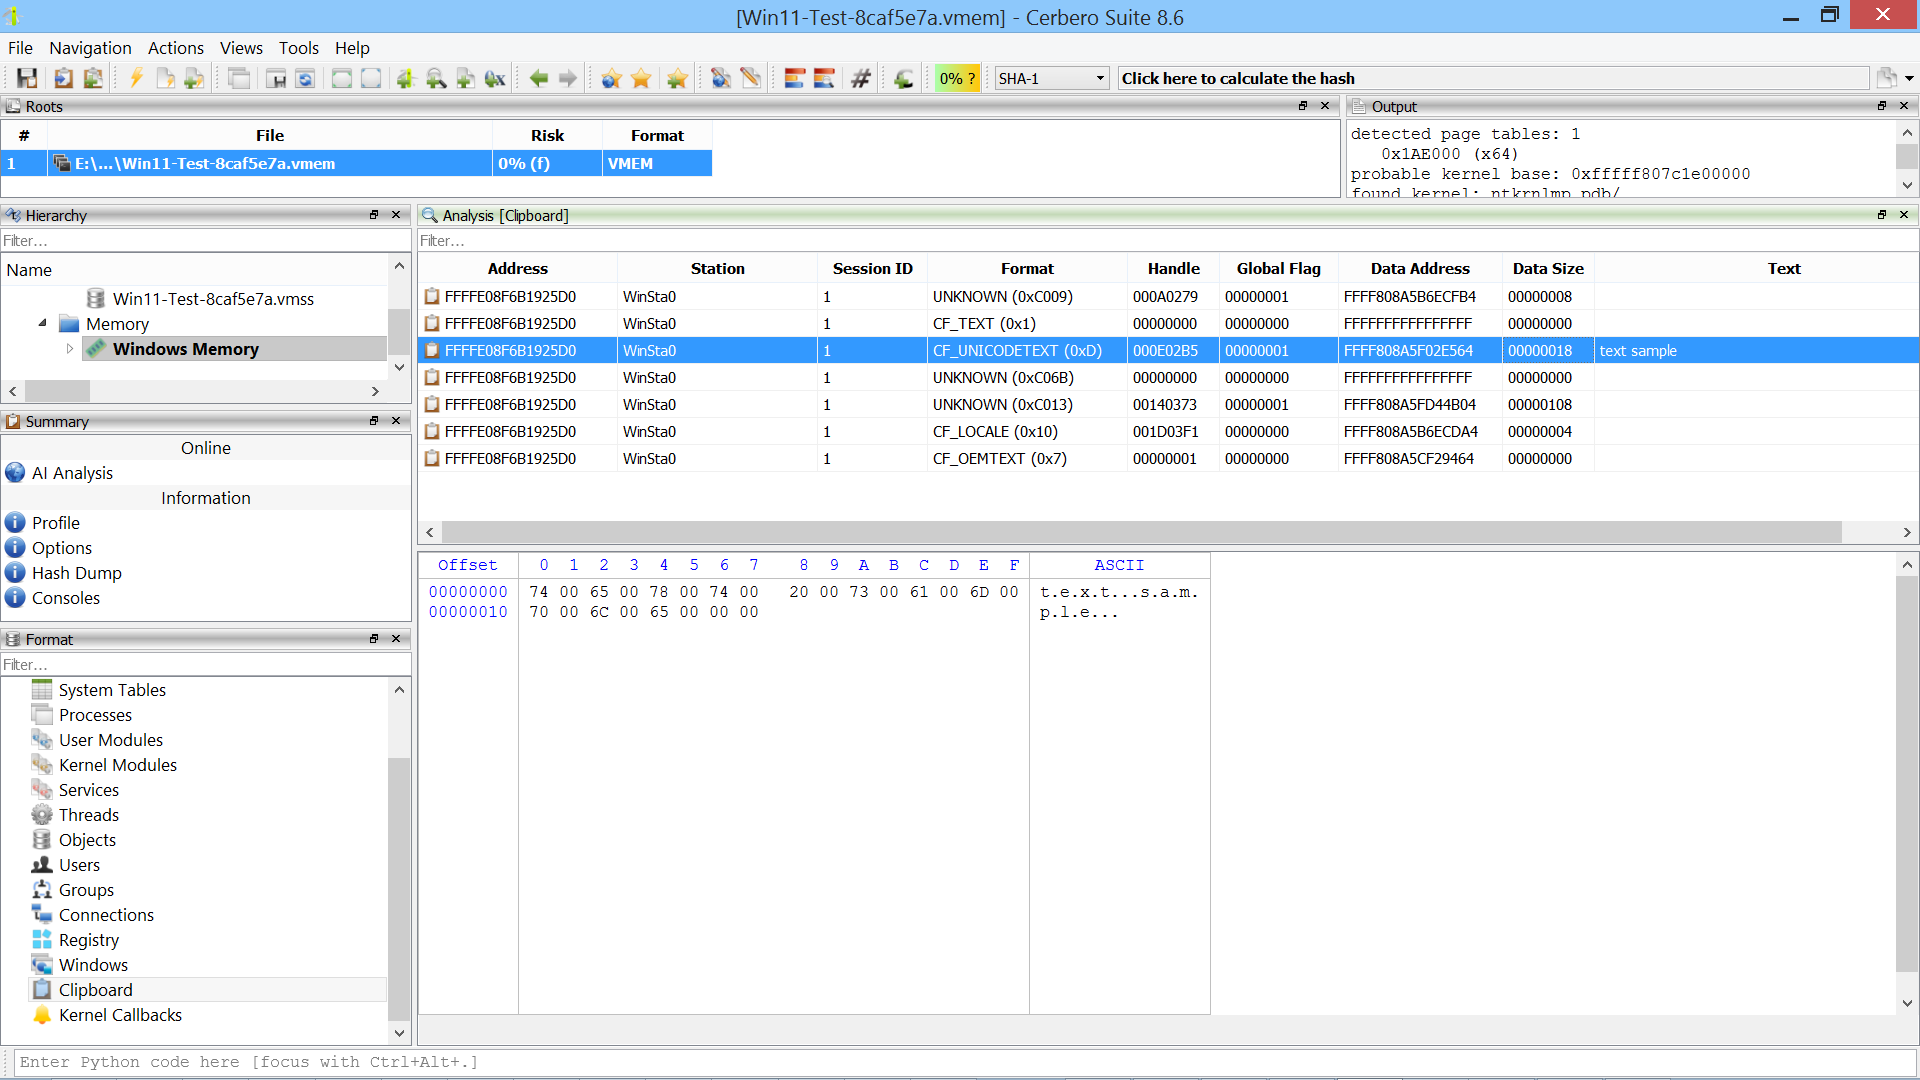
Clipboard data is extracted.
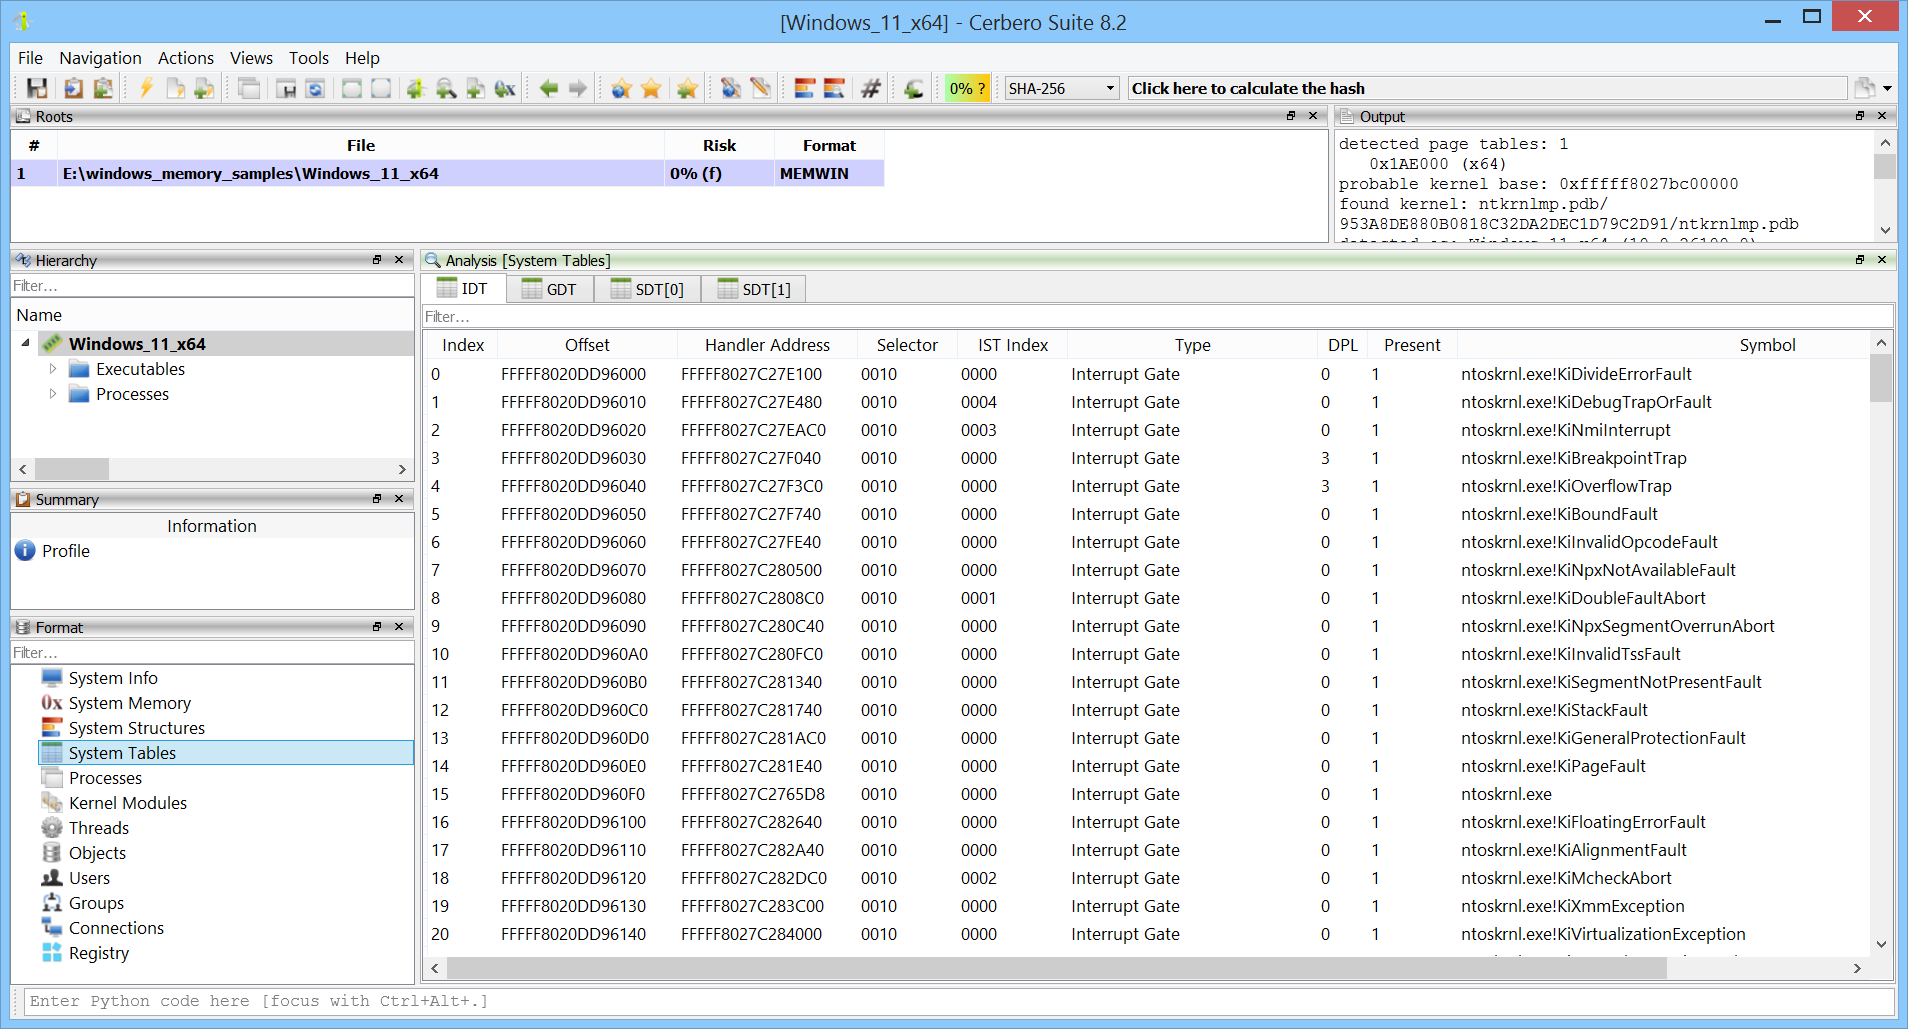
Architecture-specific tables such as the Interrupt Descriptor Table are supported.
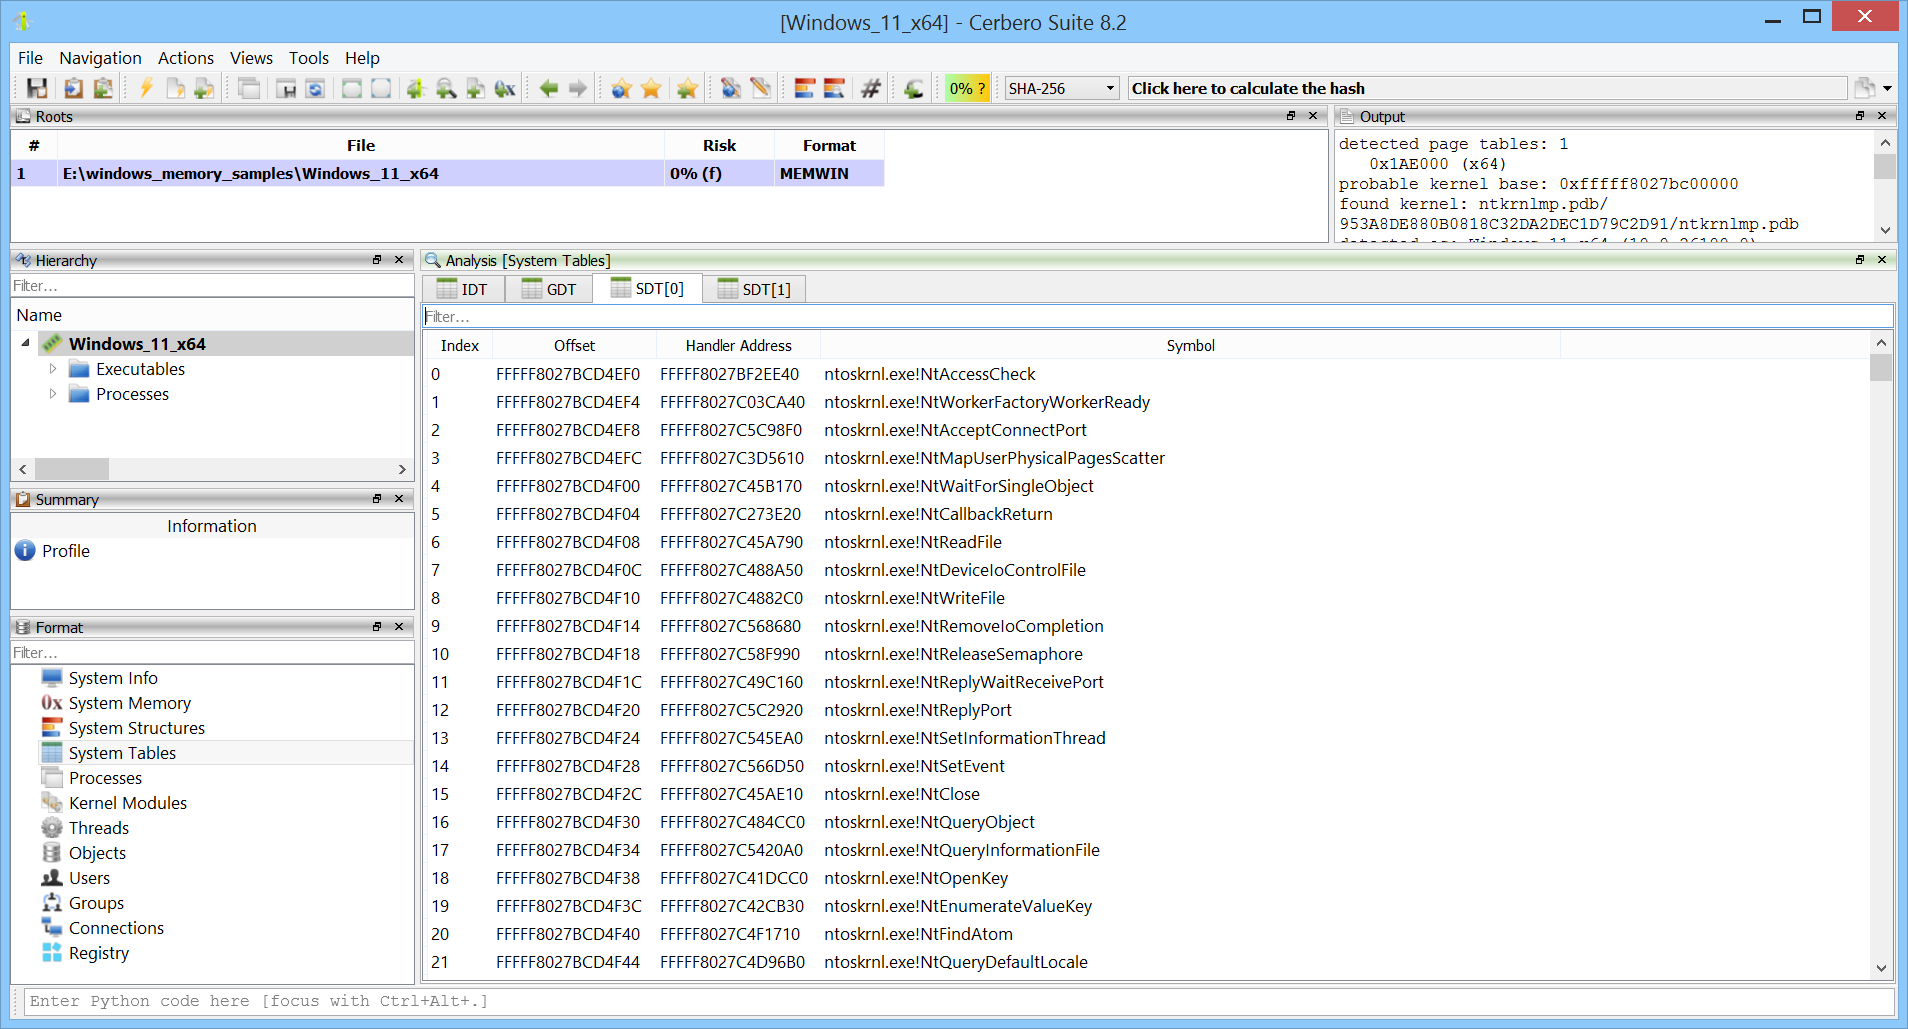
Similarly, the Windows Service Descriptor Table can be inspected.
Each process can also be individually inspected as a child object.
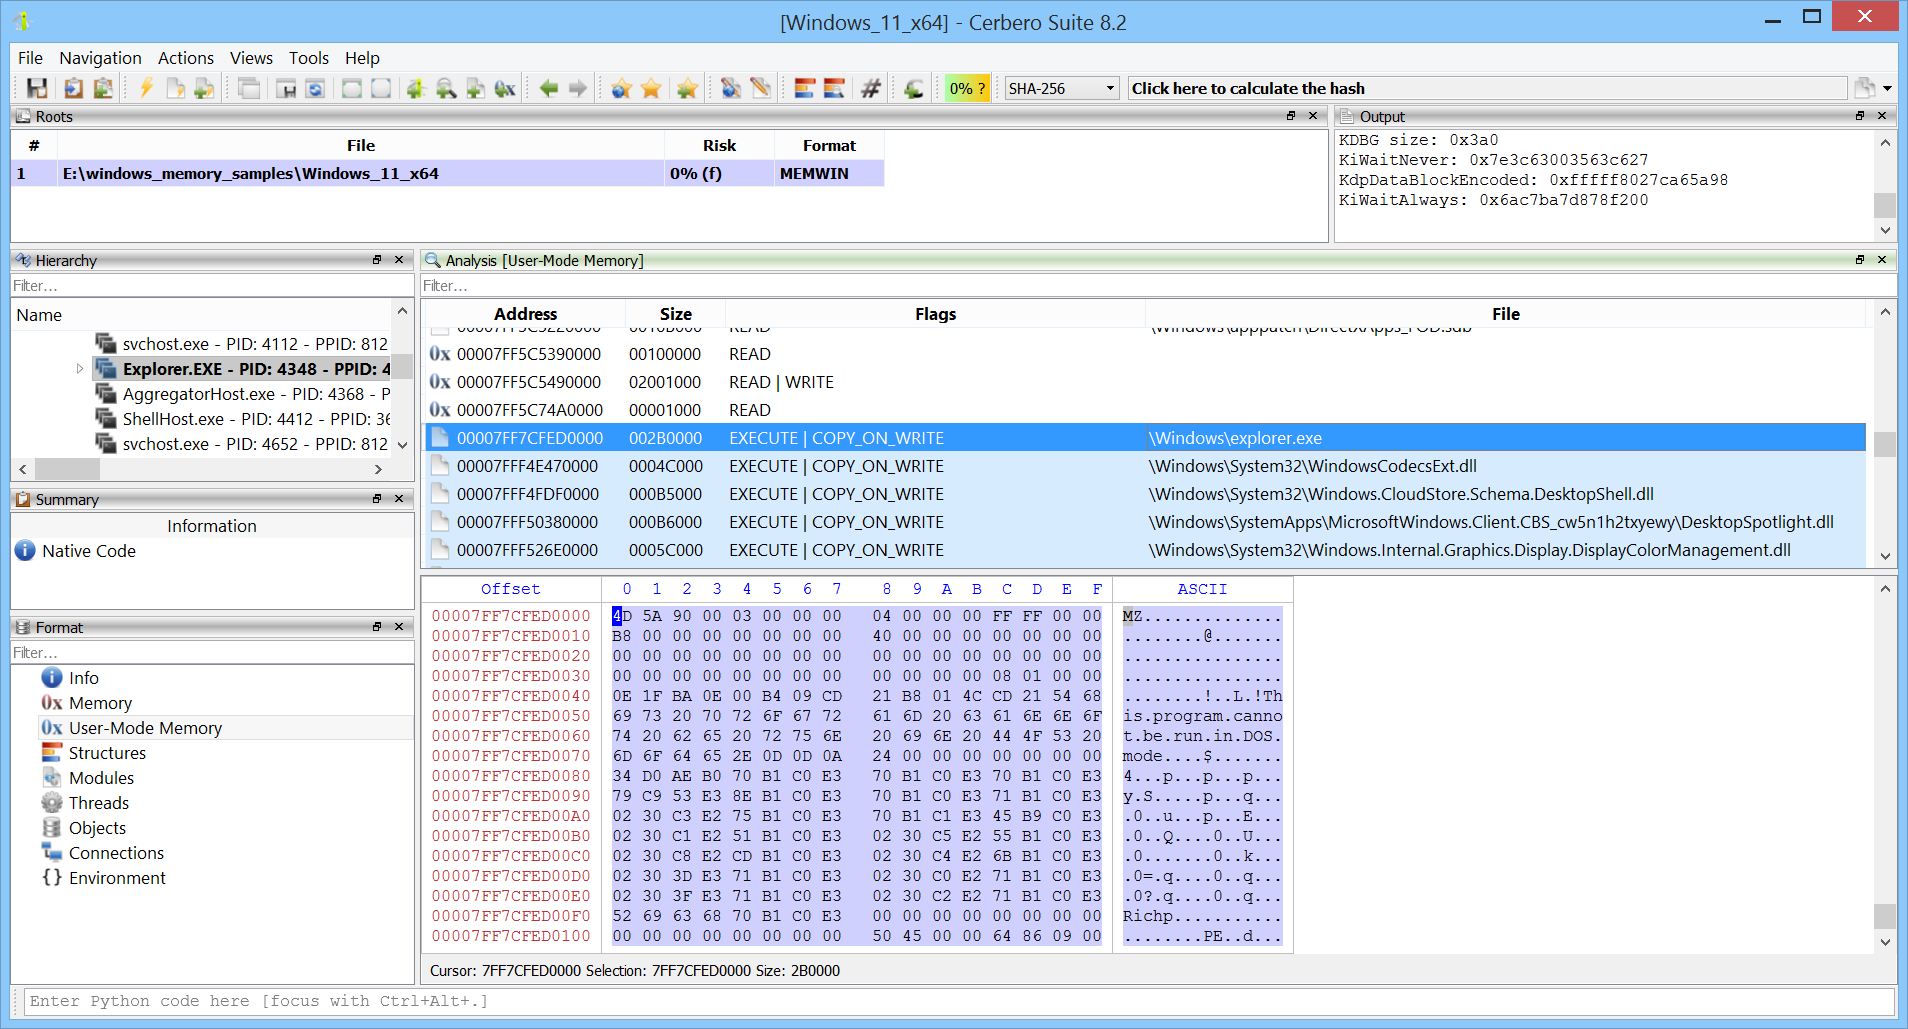
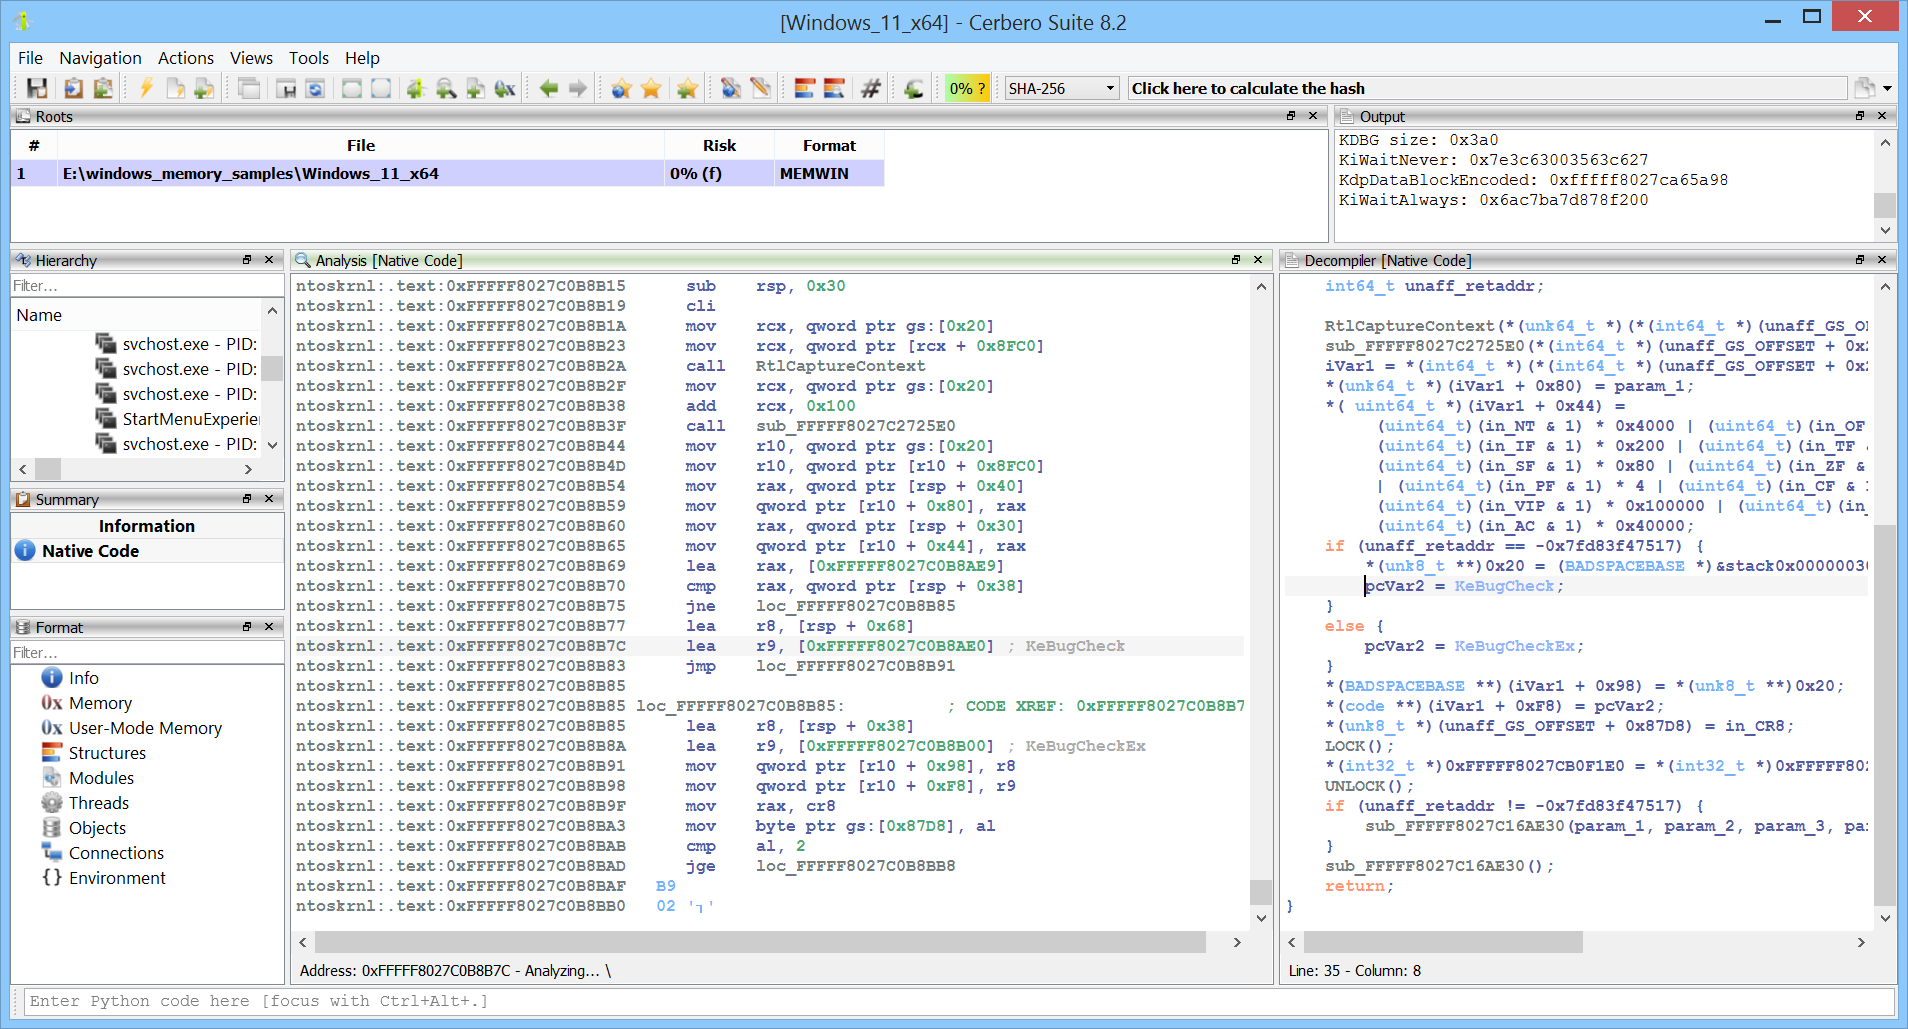
The complete address space of a process can be analyzed using the Carbon disassembler.
A file scan action is provided to detect file objects in memory and extract their cached data.
Windows pool scanning is also supported.
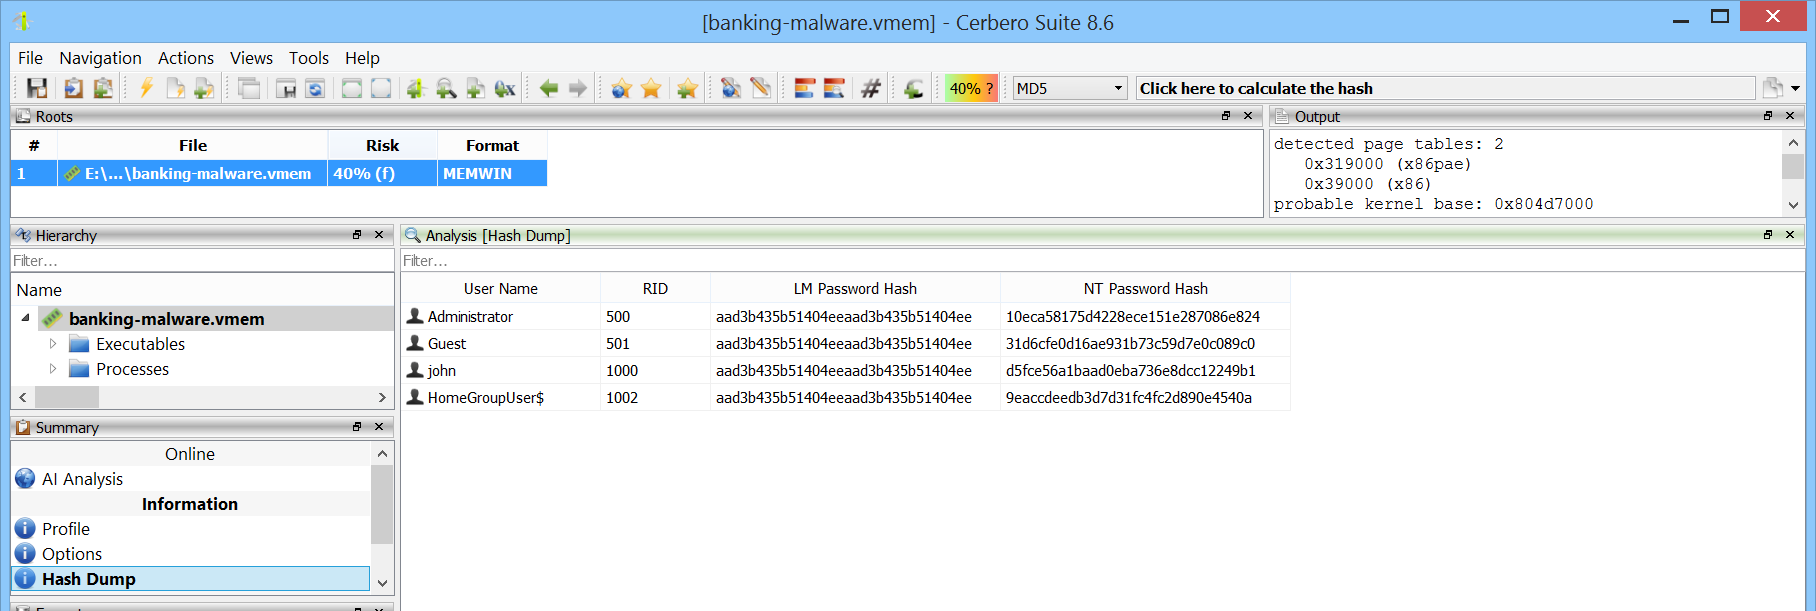
User password hashes are decrypted and ready to be cracked with external tools such as hashcat.
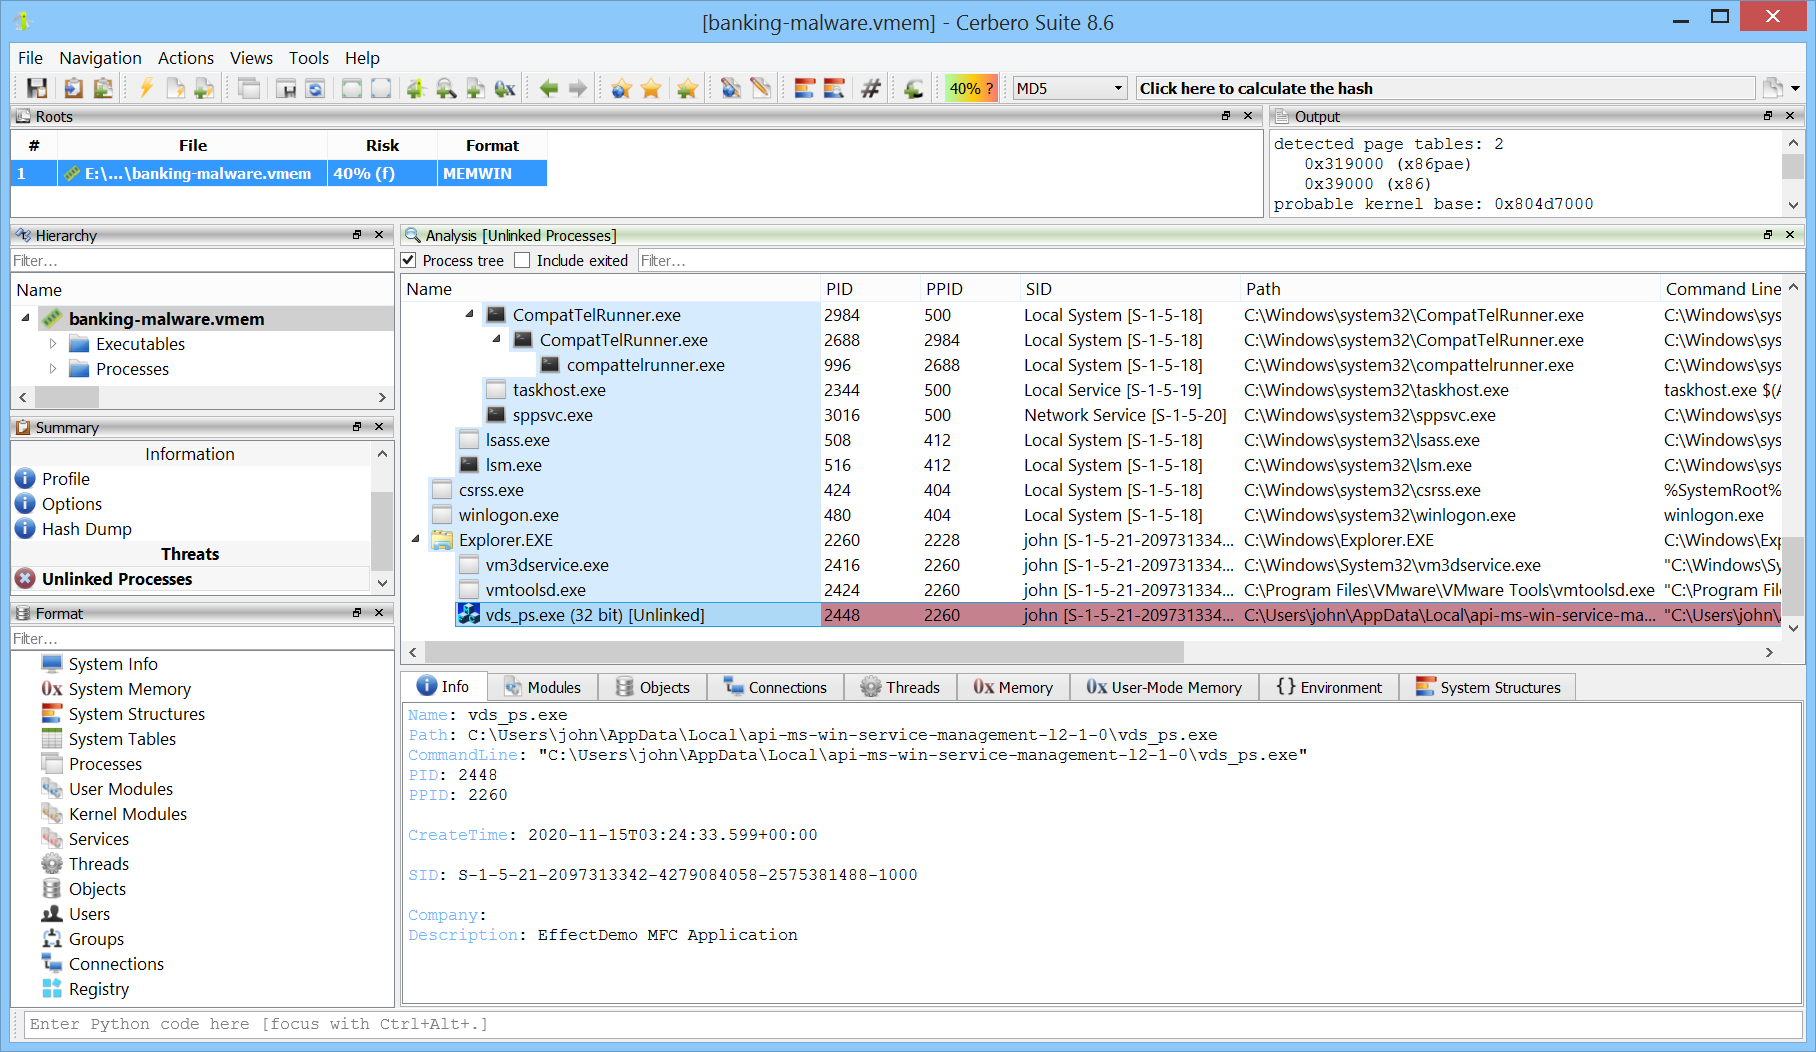
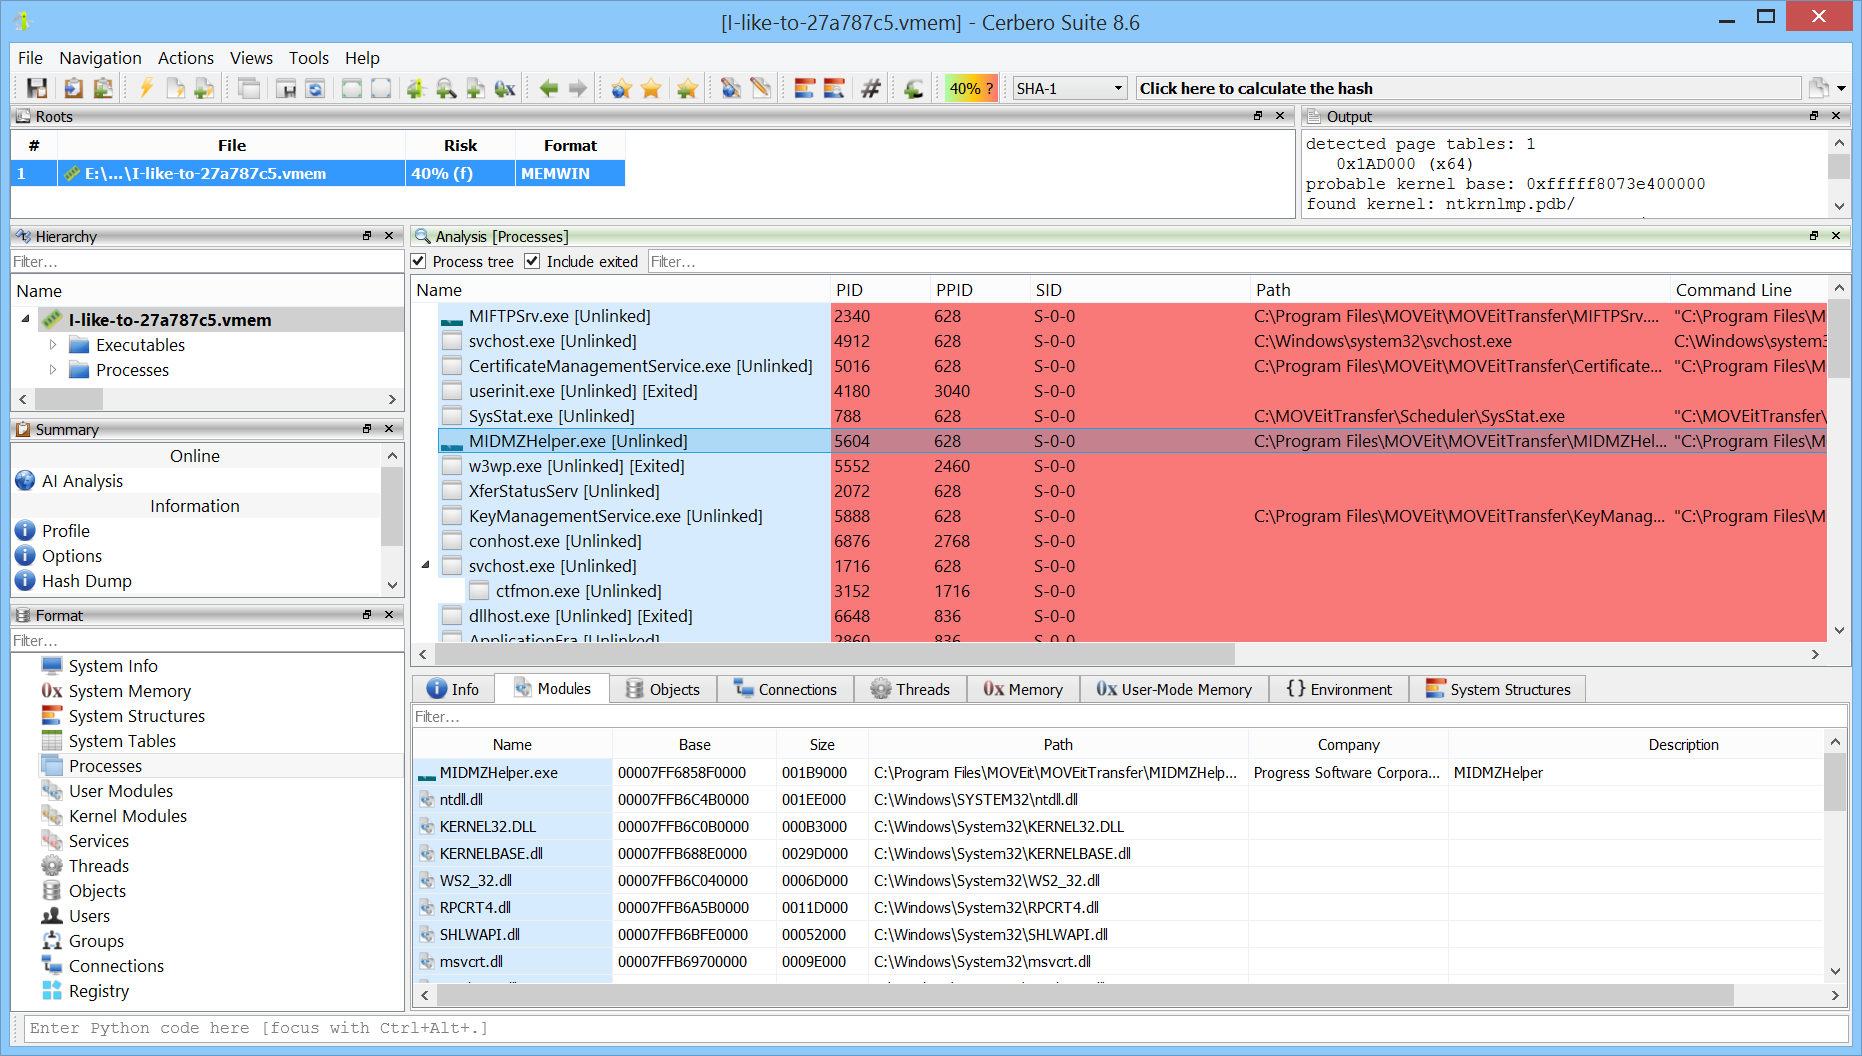
Unlinked processes can be detected.
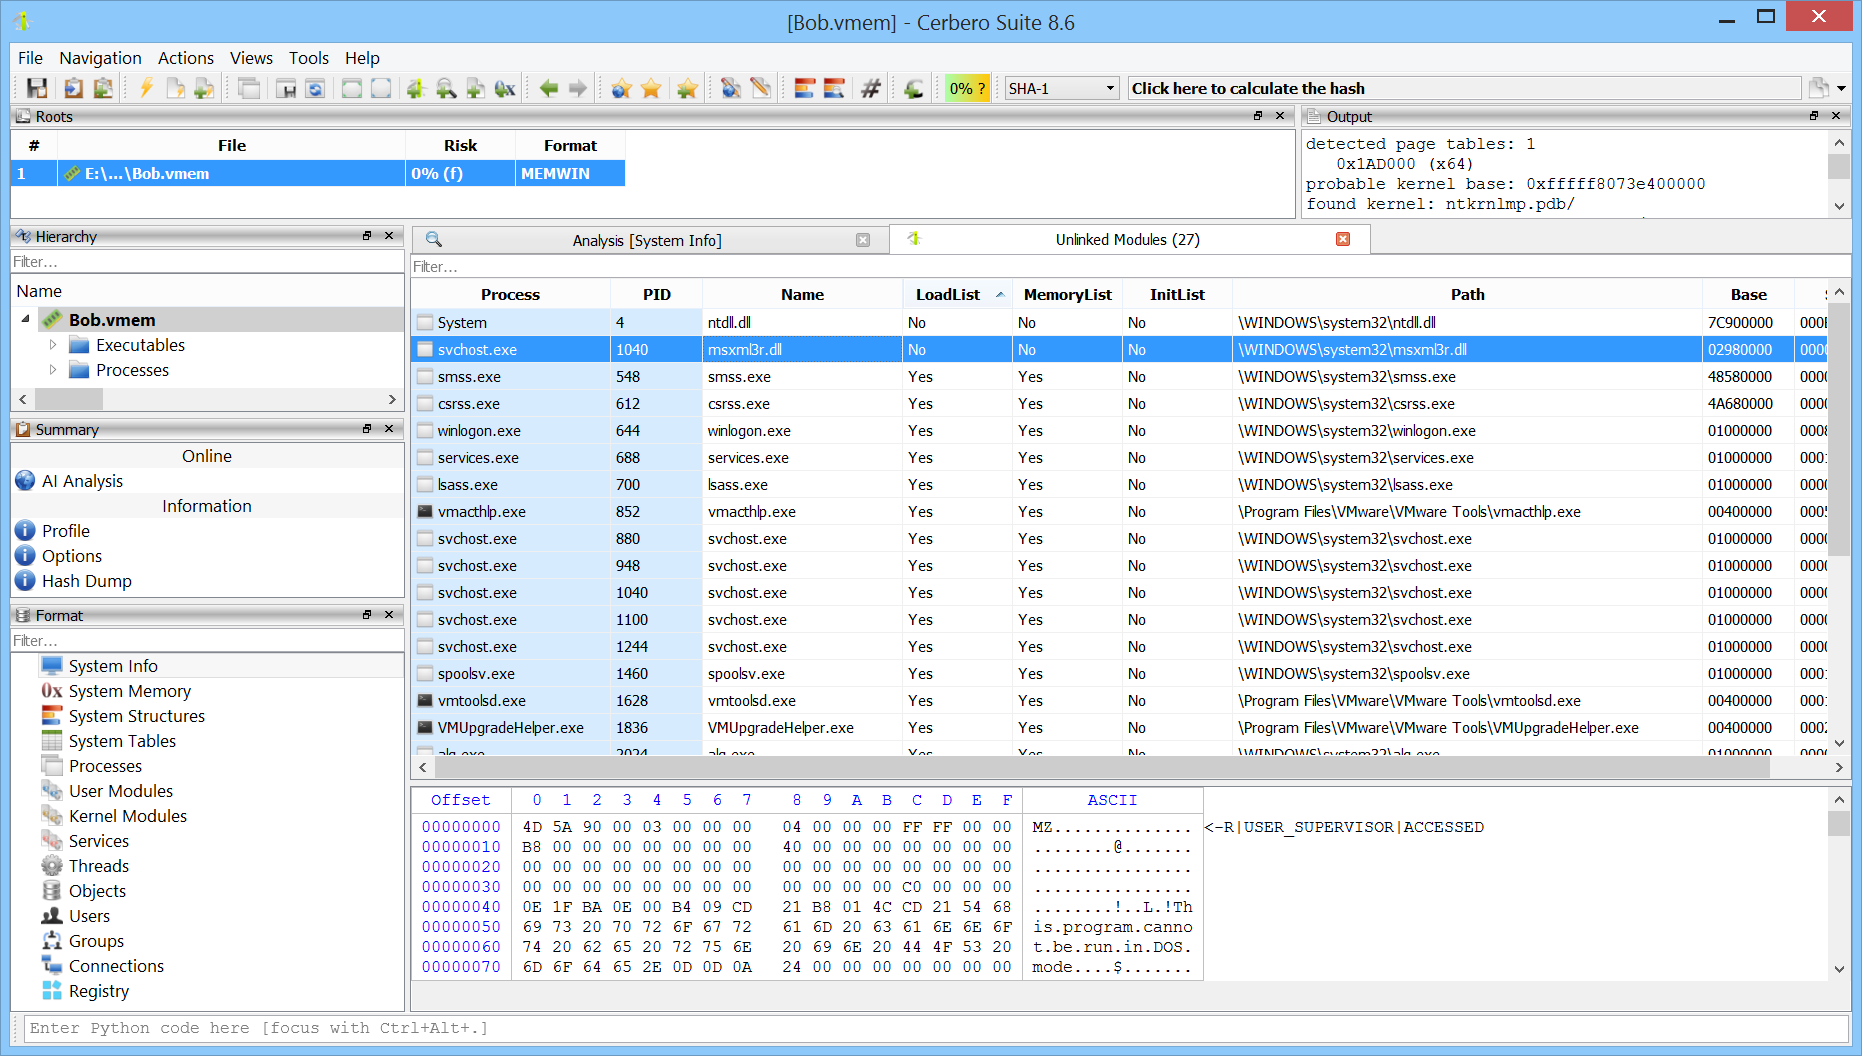
Unlinked modules can be detected.
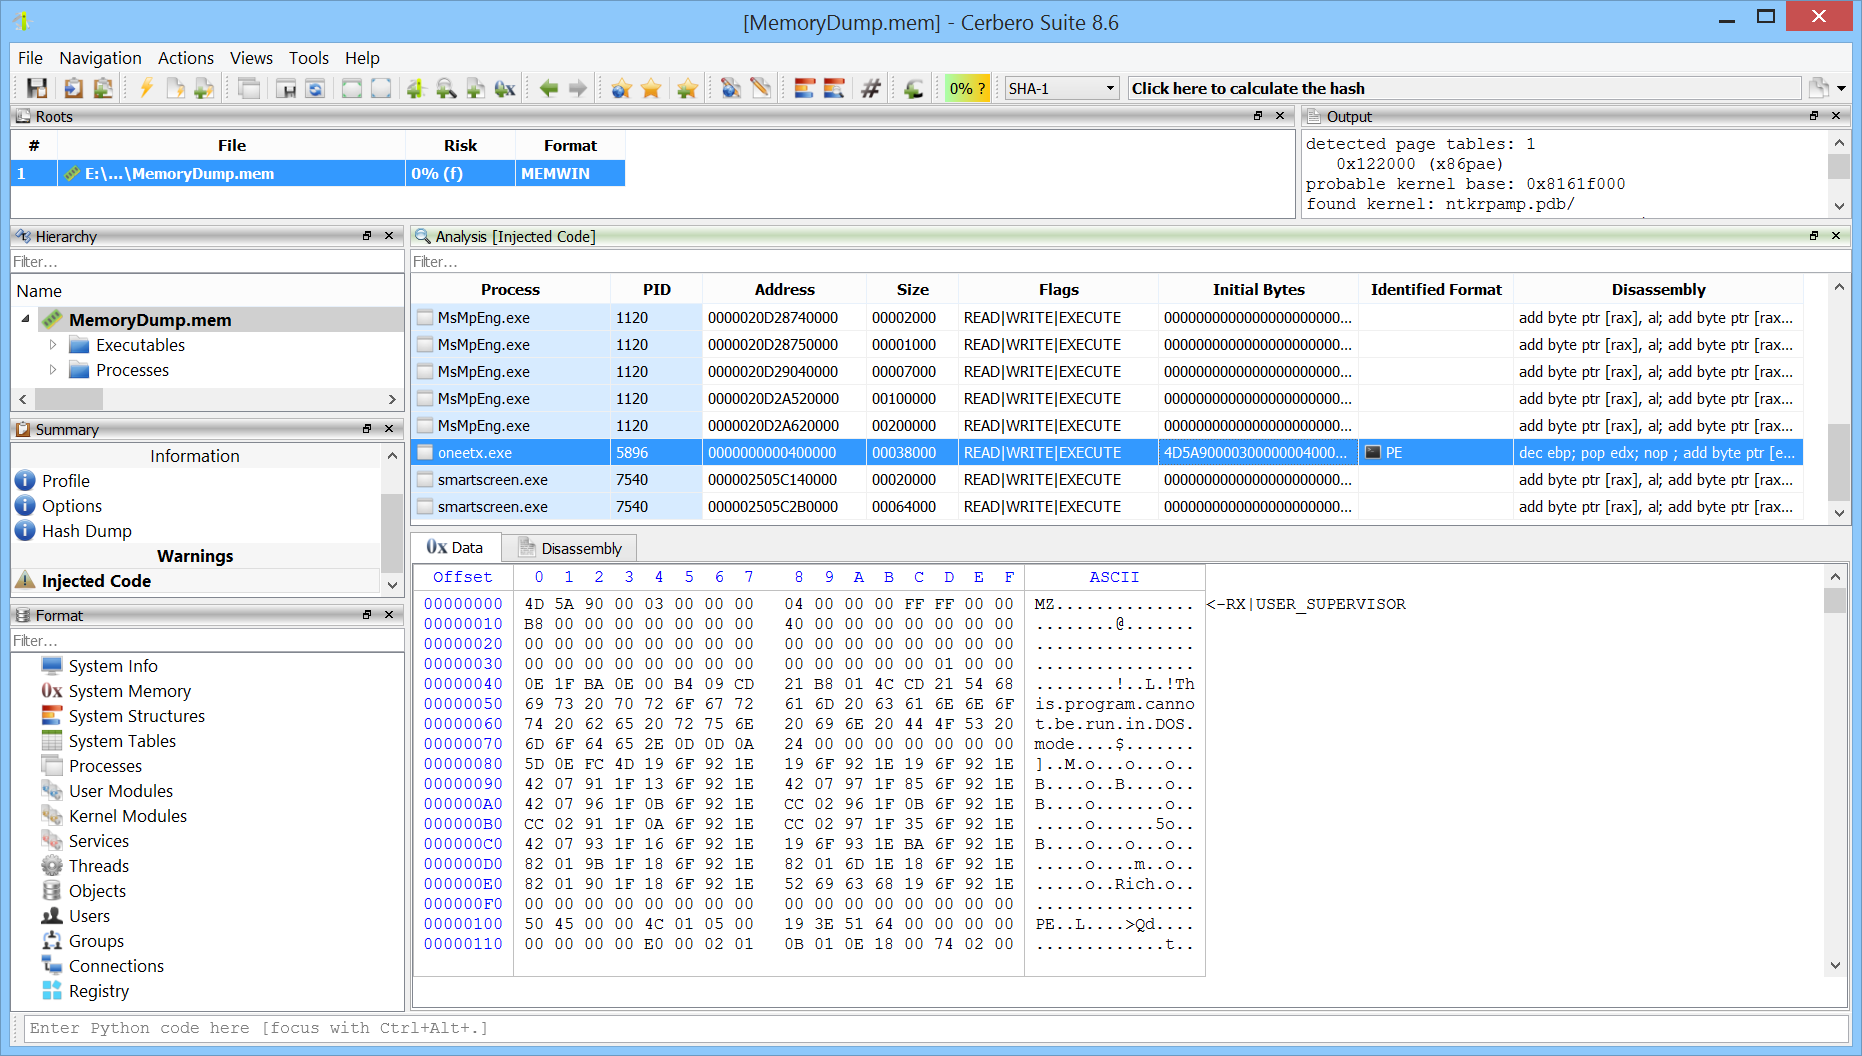
Code injection can be detected.
Processes can be recovered using pool scanning to extract information from corrupted dumps.
Modules and files can be scanned using YARA. Additionally, the user-mode memory of processes can be scanned using our cutting-edge YARA Rules package.
User-mode memory can also be mined for files using the File Miner package.
It is possible to exclude any user-mode memory region simply by unchecking it, and the exclusion is reflected immediately in the hex view. This allows for faster mining of files, string searches, and other operations that may be slowed down by large reserved areas.
When inspecting a PE in memory, viewing the import table is useful—but seeing what the IAT entries actually point to is even better, especially when import information is no longer available.
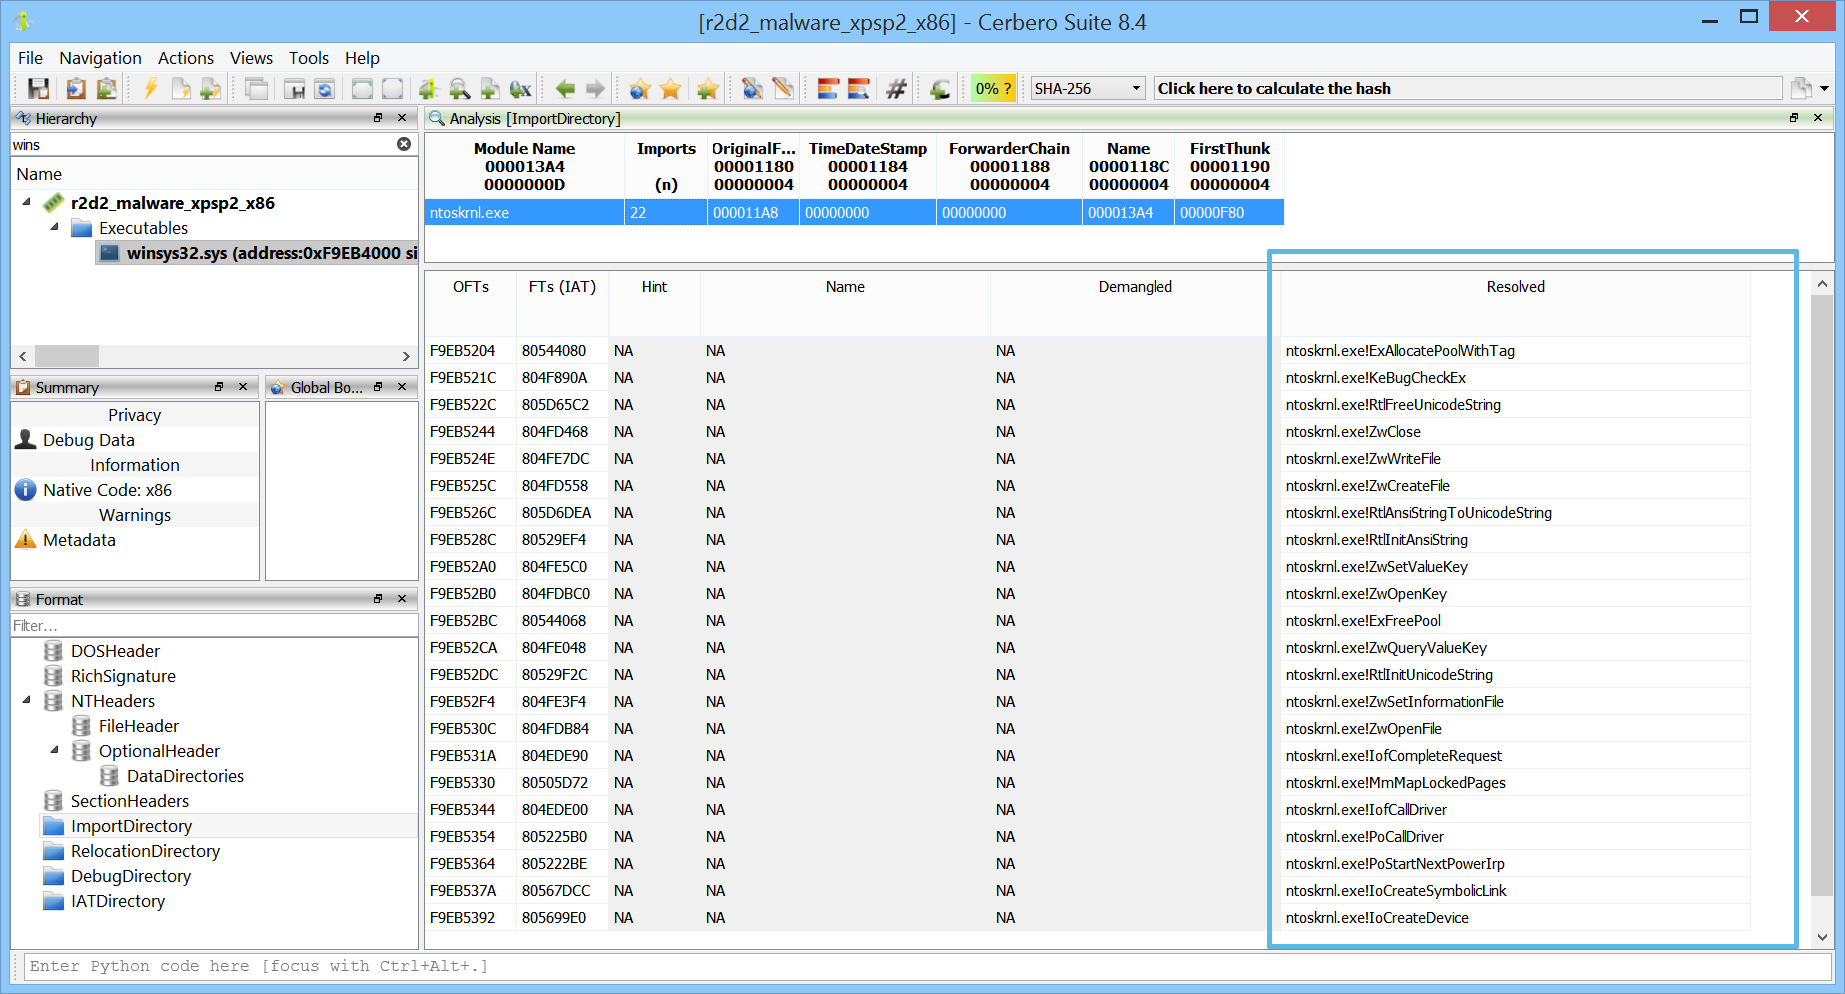
Forwarded entries are highlighted.
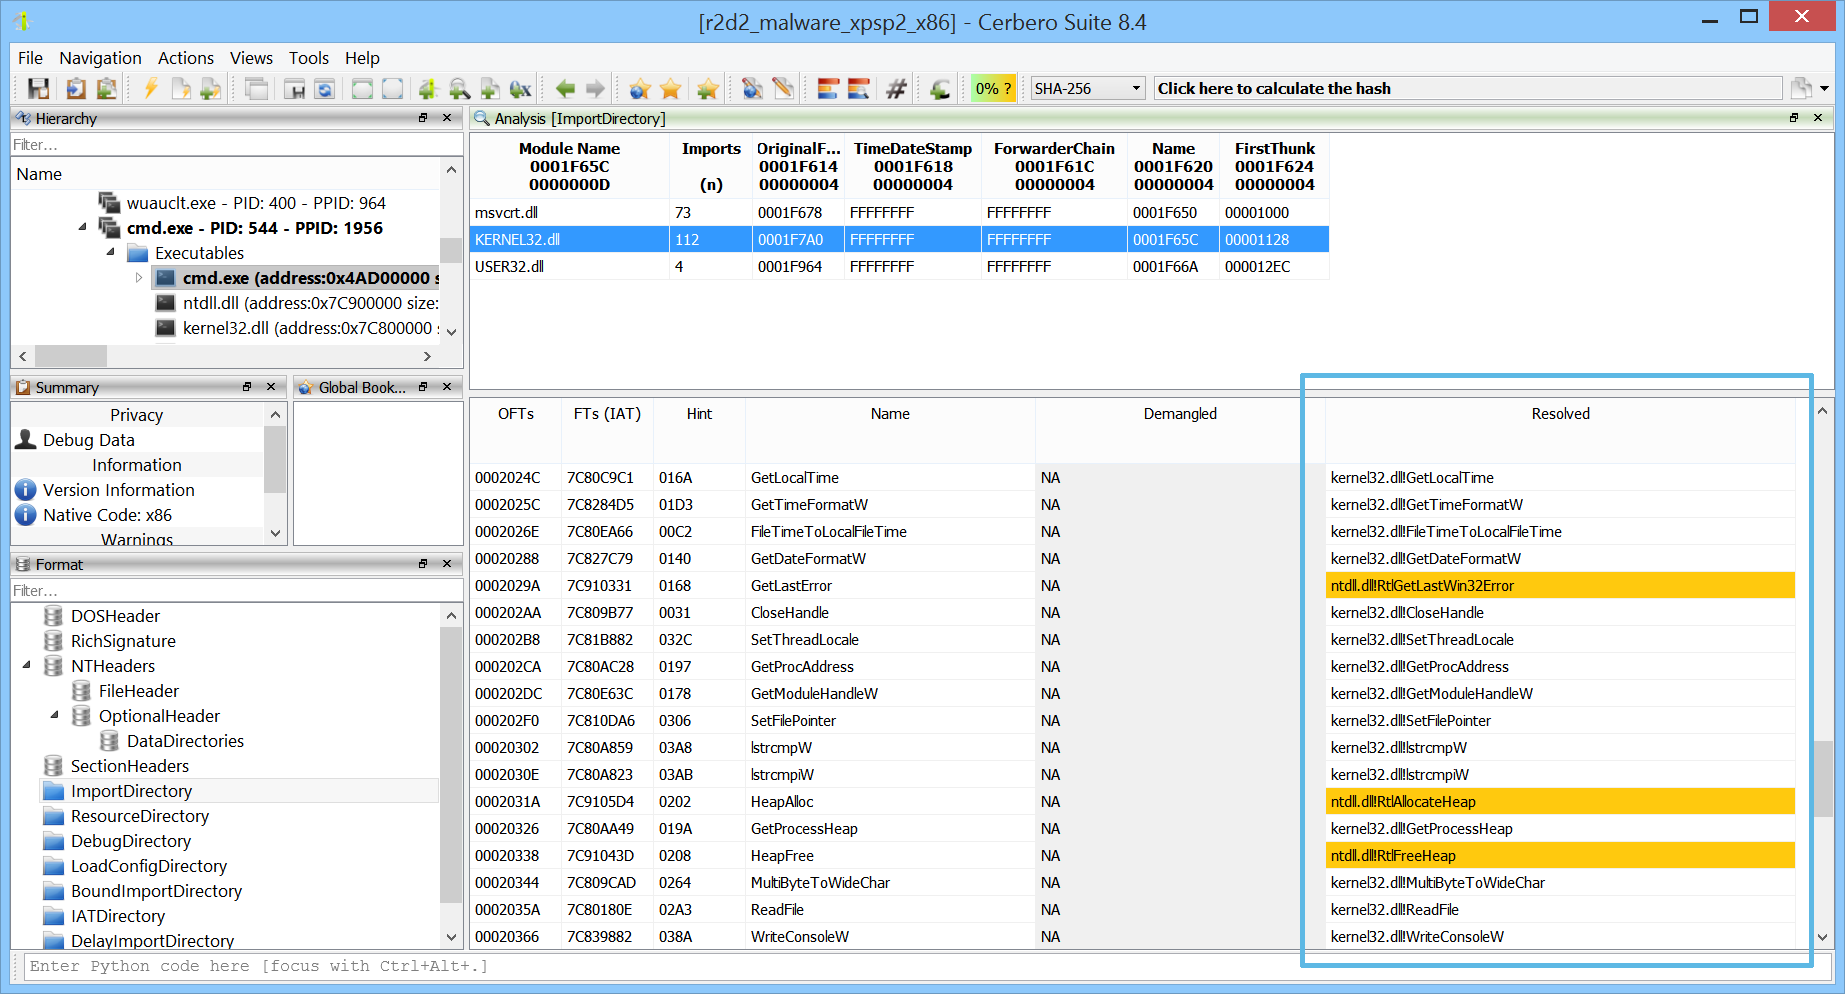
Hooked IAT entries stand out even more clearly.
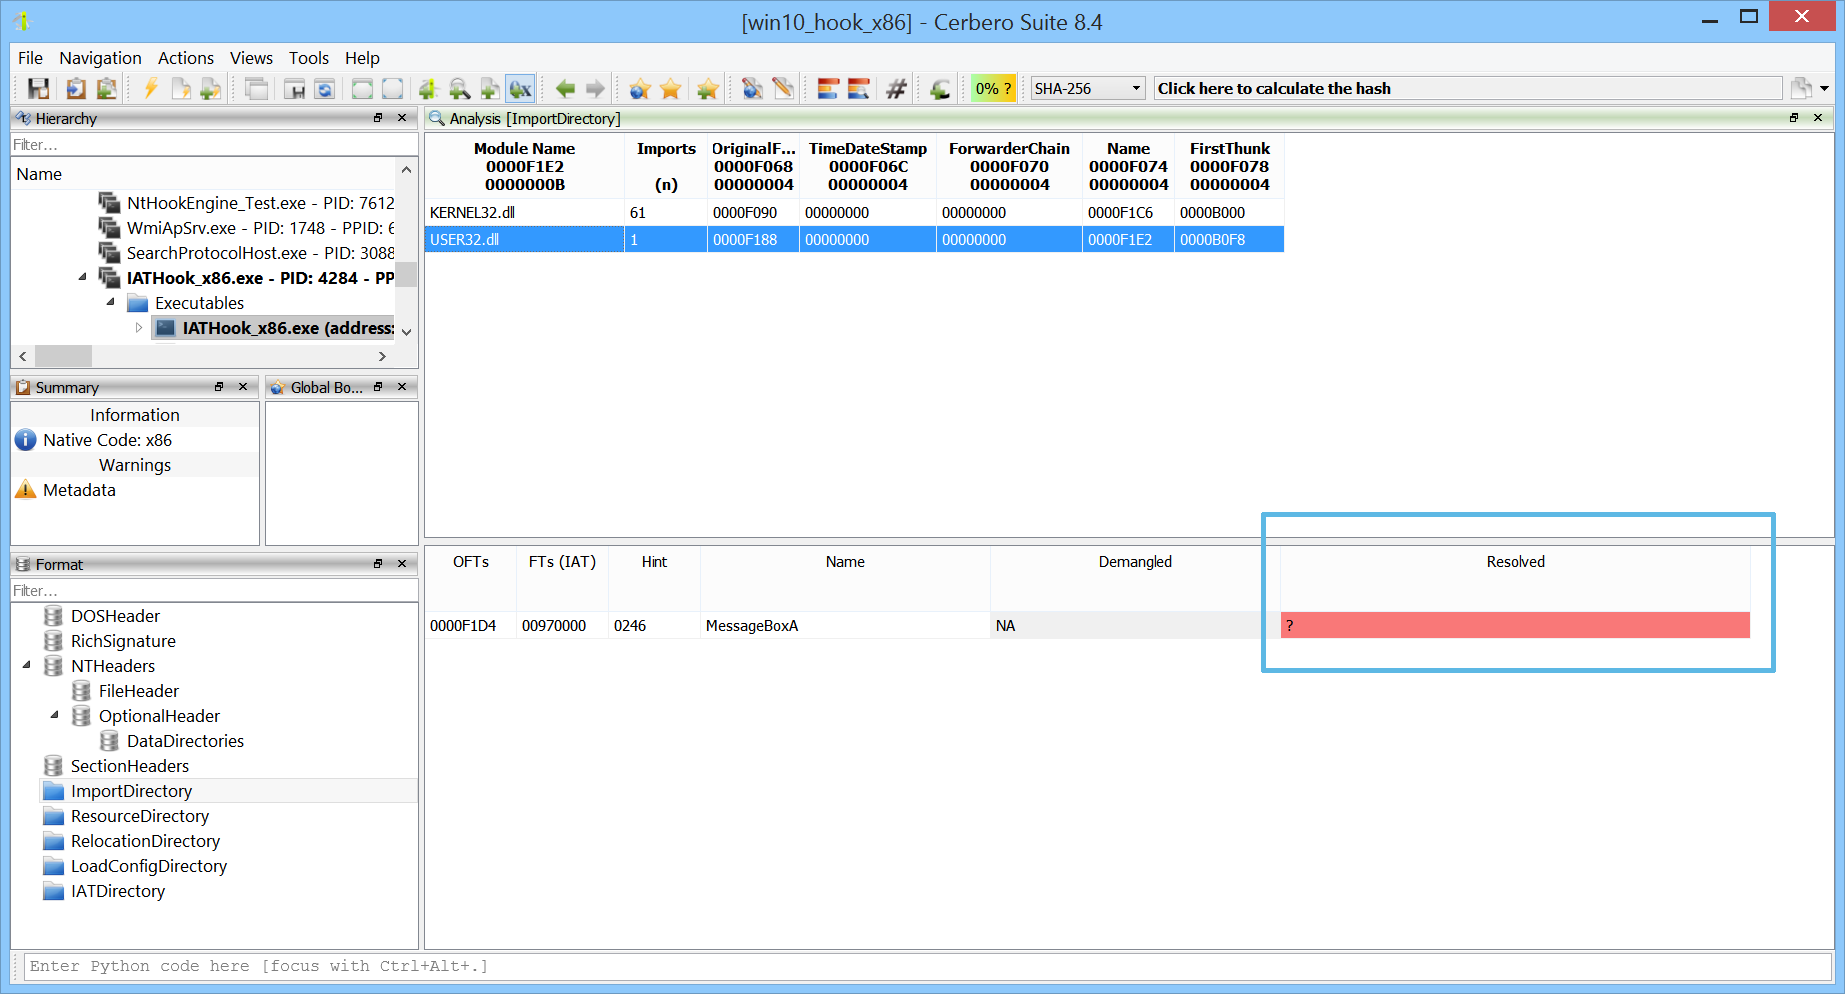
When the original and first thunk arrays are identical and import names can’t be recovered, disassembly becomes difficult to interpret.
Dynamically resolving IAT entries allows the disassembler to recover imported functions, making the disassembly easier to understand.
Crash dump formats such as VMWare Suspended State (VMSS) files can also be inspected directly from the UI.
The package is also fully exposed through the SDK.
